Charts
Charts provide a graphical view of our objects, and are often useful tools to make decisions. Charts shouldn't be used in isolation but are a tool in your kit bag to make meaningful decisions about your portfolio.
Charts are fully configurable.
The types consist of:
Bar charts
Scatter charts
Word clouds
Select the Charts module 

Fill in the details as below
oChart Type: Stacked Bar
oName: High-Cost Requirements
oDescription: Those requirements that are perceived as high cost.
oObject Type: Requirement
oBar Alignment: Vertical
oSort By: Value (Descending)
oPress the Add Attribute button
oIn the first attribute dropdown, select Cost
oIn the second drop down select Difficulty
In the Data section, select the Search option to begin selecting the objects to be added to the chart.
In the section that opens click Search, when you selected the object type on the previous screen you already limited the object type and we want all objects of that type.
Check all existing Requirements, and click ADD.
Click SAVE.
Select the CHART tab, at the top of the page

The Cost and Difficulty attributes have colors assigned automatically, they can be changed on the CONFIGURE tab, if required.
Select an object from within the chart to open the in-context editing pane – allowing editing of the object and its attributes directly from the chart.
Here we have seen how we can quickly create simple stacked bar charts of objects, displaying some of their numeric attributes.
|
|
Note that numeric ranges are scaled to create similar sized bars |
Another type of chart is a Word Cloud. Word clouds allow you to look for common terms in object descriptions. An example is shown below;
Optional - Create a word cloud chart, based around the requirements�
The size of each word reflects the frequency of the word in the selected objects' descriptions.
Word clouds are useful when you want to understand qualitative information. A pictorial representation can make dull objects sizzle. You can 'wow' stakeholders with a visual graphic of your findings, before diving into specifics.
Application Components and Analysis
You will now shift your focus to understand the application components, that realize the requirements, to fulfil the goal Revise claim handling process.
The first task is to create the Application component objects, update their attributes, and establish relationships to other objects in the model. You can then view and analyze the model, using diagrams and roadmaps, and track progress using kanban boards.
To do this we will use the import function again to import some Application components.
Click the URL below to download an import file onto your machine;
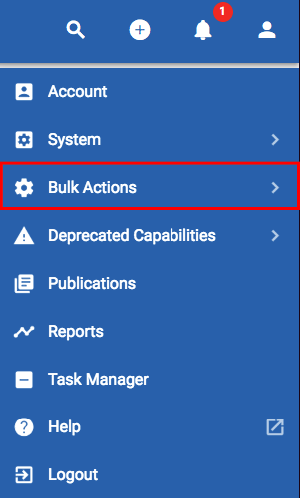
Once you have downloaded the file, in the Agile EA tool, navigate to the User menu > Bulk Actions > Object Import.

Select the file that was just downloaded to your machine - Corso_Agile_EA-Application_Component_import.zip and drag it into the upload box, or press the Click to upload button.
Click the IMPORT button 
If the import is successful, a success message will appear on your screen. A log should also report a successful import of the individual objects and relationships.
Scorecards
Some of the analysis we want to perform is going to make use of Scorecards within our Application components.
A Scorecard calculates a 'score' from attributes of the scorecard. One or more of these attributes can take their value from other attributes of the object. For example the value of Application Lifetime Cost is calculated from several attributes; Expected Lifespan, Monthly User Cost, Number of Users, License Cost, and Maintenance Cost.
Enter the following values into the named Application component objects' Application Lifetime Cost attribute, (instructions below table).
Application Lifetime Cost Scorecard Values
|
Object to edit |
Values to enter |
|
Web Portal |
Expected lifespan – 6 years License Cost (Perpetual) – 30000 Maintenance Cost (Perpetual) – 3000 |
|
Home and Away Financial Application |
Expected lifespan – 5 years Monthly user cost (SaaS) – 250 Number of Users - 100 |
|
CRM |
Expected lifespan – 5 years Monthly User Cost (SaaS) – 350 Number of Users - 50 |
|
Home and Away Policy Administration |
Expected lifespan – 5 years Monthly User Cost (SaaS) – 200 Number of Users - 15 |
|
Call Center Application |
Expected lifespan – 6 years License Cost (Perpetual) – 50000 Maintenance Cost (Perpetual) - 10000 |
|
Customer Data Access |
Expected lifespan – 5 years Monthly User Cost (SaaS) – 50 Number of Users - 25 |
To do this:
Select the All Objects module 
Locate each of the Application component objects, one at a time, from the table shown above.
oExpand the Application Lifetime Cost attribute (example image below) - this attribute is part of the Costs category.
You might want to remove other categories or filter the attribute list with the text cost.
oEnter the values into the fields as per the table above.
oSAVE the changes to the object.
oContinue to the next object in the table.
Locations
Create the following Location objects:
Name: Back Office
Select the Object Type "Location" (The Location attributes should appear below).
SAVE the object.
Select the RELATIONSHIPS tab

Click the Create the first Relationship button, to add a new relationship
Click on the Relationship Type field and choose the ‘aggregates (is aggregation of)’ relationship.
Click on the Object Type field and select the Application component type.
In the list of Objects, check Customer Data Access, Home and Away Financial Application, and Home and Away Policy Administration checkboxes.
Once all three Application components have been checked, SAVE the relationships.
The relationships should look like the following;
The recent import of Application components also included a Location named "Front Office", with a single relationship. Additional relationships can be created.
To do this:
Locate the Front Office Location object.
Access the RELATIONSHIPS tab
Select the Edit button 
SAVE the new relationships.