Dashboard
Dashboard
Role Applicable to: Client Administrator, User, Contributor, Reviewer
Personal Dashboard
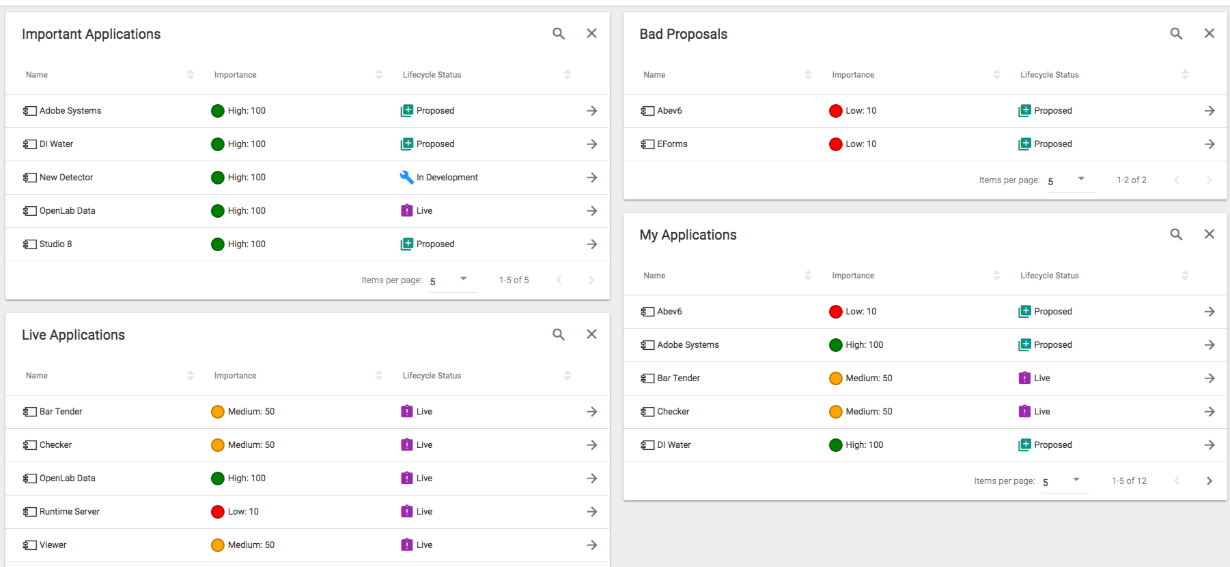
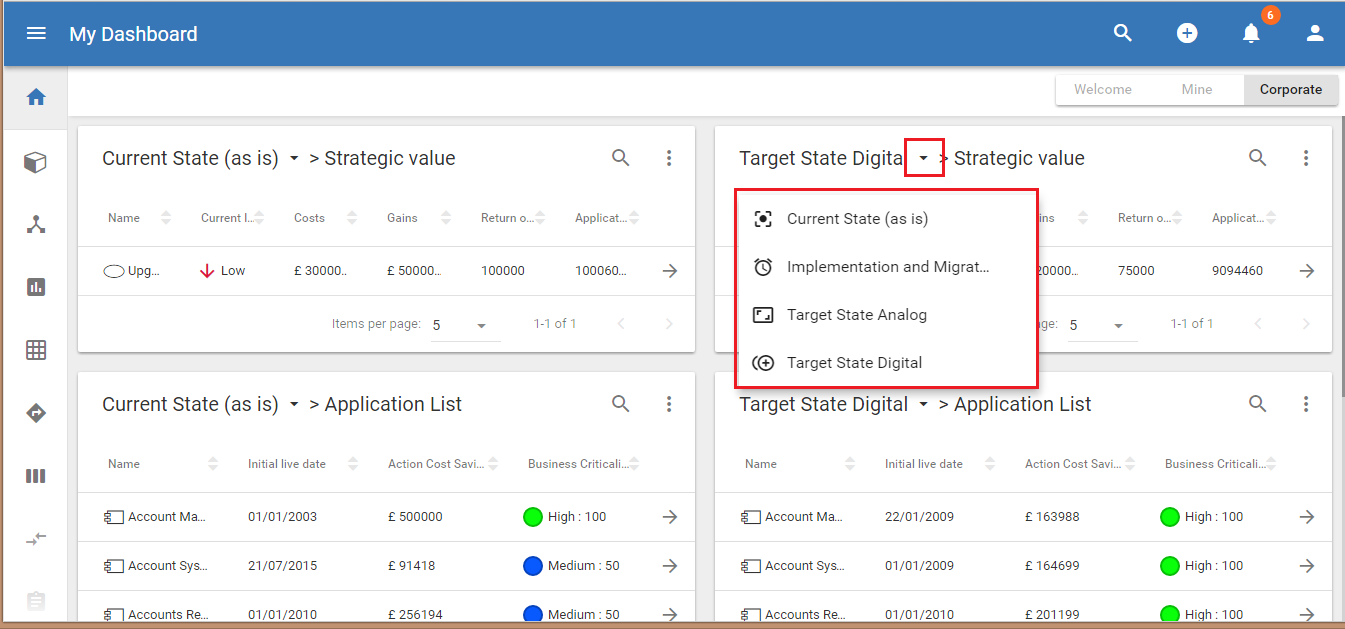
The personal dashboard provides the user with the ability to add 'views' that the administrator has created for them. They can be added using the '+ Add Visualization' option on the dashboard.
If the user has the correct permissions and can see the view, they can select it from the dashboard and be taken into the view. In the view they can use the option menu, to choose which columns are displayed within the visualization.
Views can switch between workspaces on the dashboard. This makes it very easy for users to see the different datasets contained in different workspaces, run against the queries set in the views, and compare them in a simple way.
Corporate Dashboard
The corporate dashboard is provided by your administrator to show company wide views and visualizations on the platform. The administrator controls these views and they are not editable by the users.
Kanban Boards
Kanban Boards
Role Applicable to: Client Administrator, User, Contributor, Reviewer
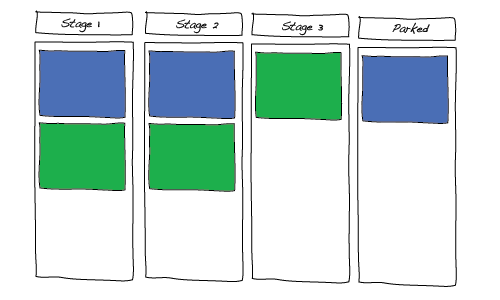
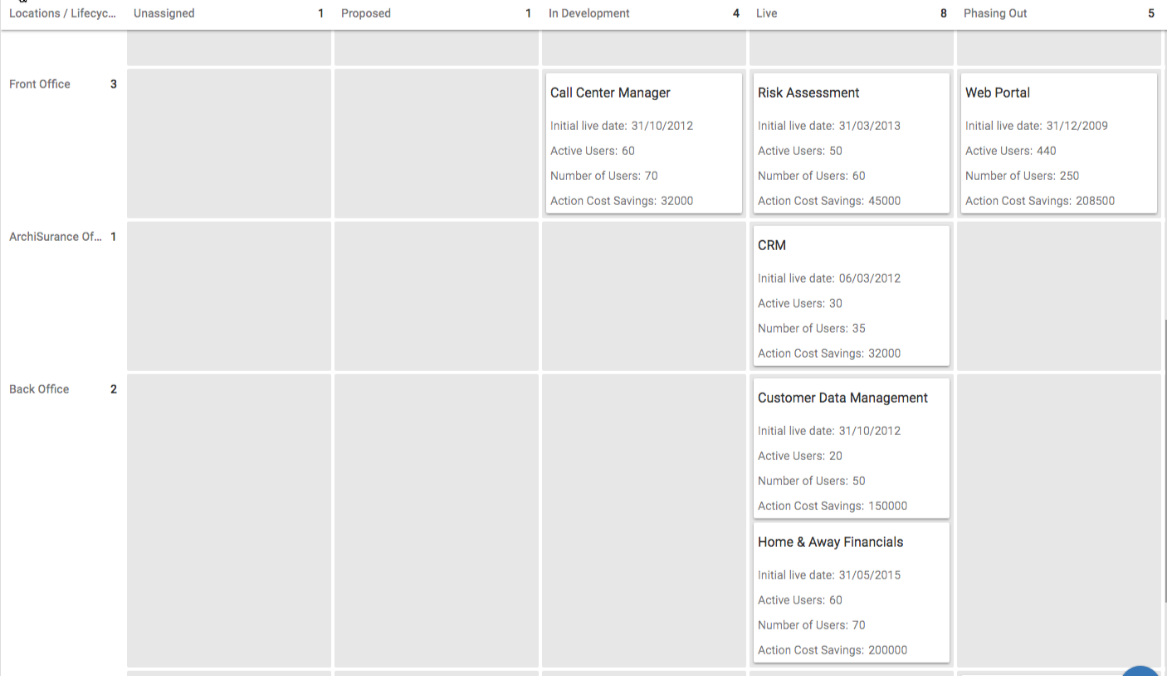
Kanban boards are the visual storyboard for a process or workflow. They represent the journey and the objects within that journey. Objects are represented as cards on the board. Objects may be moved from one stage to another by dragging.
|
|
Kanban boards are based on the concept of Kanban. A Kanban is a tool to visualize, organize and complete work. The first official use of Kanban can be traced back to Taiichi Ohno’s work at Toyota. He needed a way to quickly communicate to all workers how much work was being done, what state it was in and how the work was progressing. His goal was to make information and processes transparent to everybody and not just the management team. |
Creating a Kanban Board
Kanban Boards and Roadmaps are the first of the existing views to be migrated into the View Manager. We can now use them with queries, to create dynamic datasets with multiple visualizations, rather than having to define a static dataset for each module.
Kanban boards are used to track work in progress. They are key to working in an agile manner and can be used to drive teams to deliver work.
EA objects can be added to kanban boards to show where they are in a work stream.
Objects are represented as cards on the board. Objects may be moved from one stage to another by dragging a card.
First we will define our dataset;
Select the Views module 

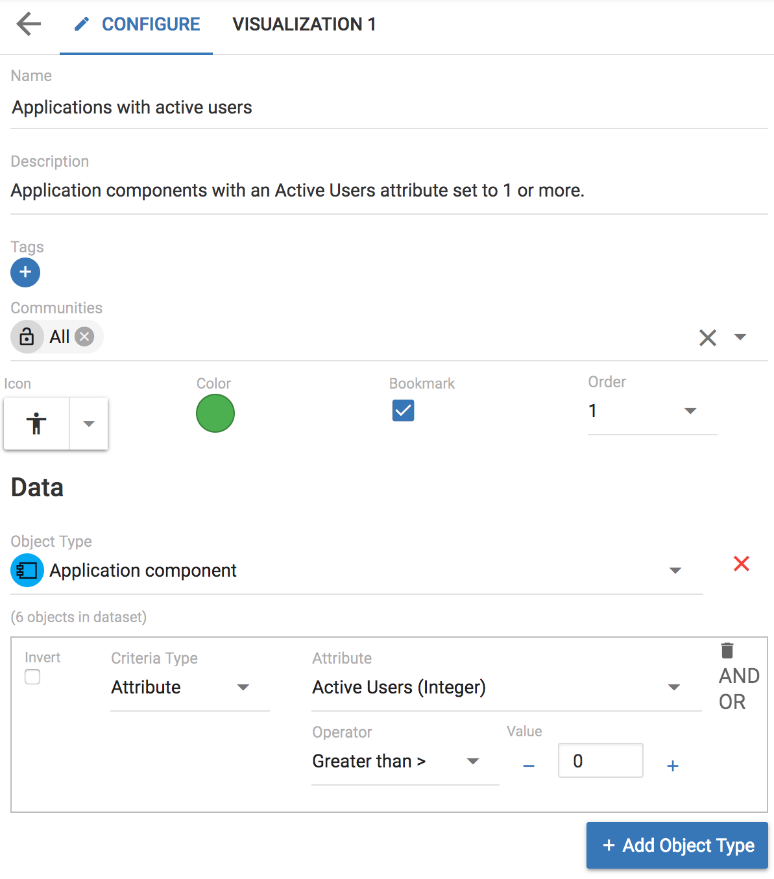
Fill in the view details on the CONFIGURE page - some example details are shown below
oName: Applications with active users
oDescription: Application components with an Active Users attribute set to 1 or more.
oIcon: Select an appropriate icon, and color, to identify the view.
oBookmark: Check the checkbox, so that the view will appear in the left-hand menu.
oOrder: Select 1 from the drop down, so that the bookmarked view will appear first in the menu.
The Data section contains the dynamic query that selects object instances to be included in the view. The selection of an Object Type will include all objects of that type in the Dataset. Any selection criteria will then filter the dataset.
An example can be seen below
Object Type: Select Application component
Criteria Type: Select Attribute
Criteria options:
oAttribute: Select the Active Users (Integer) attribute
oOperator: Select Greater Than >
oValue: set the value to 0
The query can be made more complex by combining further selection criteria. Clicking AND will make the query more restrictive, while OR will add to the possibility of being included in the dataset.
|
|
Note that multiple Object Types, with their own queries, could be part of the view by clicking the + Add Object Type button. |
SAVE the View.
A view of, Application components that have active users, now exists. Visualizations can be created for views. To create a kanban visualization from our existing view;
Select the Applications with active users view and click the CONFIGURE tab.
Click the + symbol in the top right corner
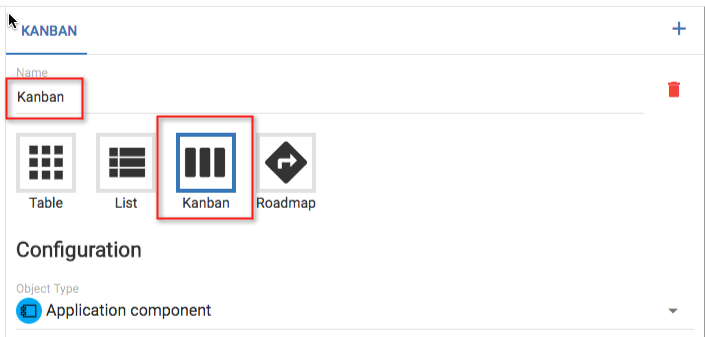
Replace "Visualization 2" with an appropriate name for your kanban
Select the visualization type Kanban
In the Configuration section of the visualization, the object type to be used in the kanban can be selected, along with the attribute that will define the stages of the kanban (Horizontal attribute) and the attribute that you may wish to group by (Vertical attribute).
|
|
Kanbans are currently limited to a single object type. |
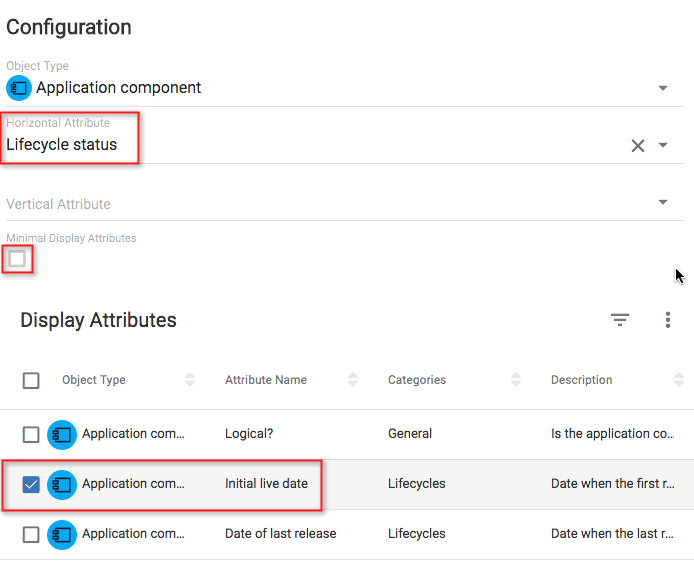
Set the Object Type
Select a Horizontal Attribute to define the stages of the kanban
Uncheck the Minimal Display Attributes checkbox (this will show just an icon if one is set for the attribute)
Check some of the attributes to display on the kanban 'cards' from the object type
SAVE the new visualization.
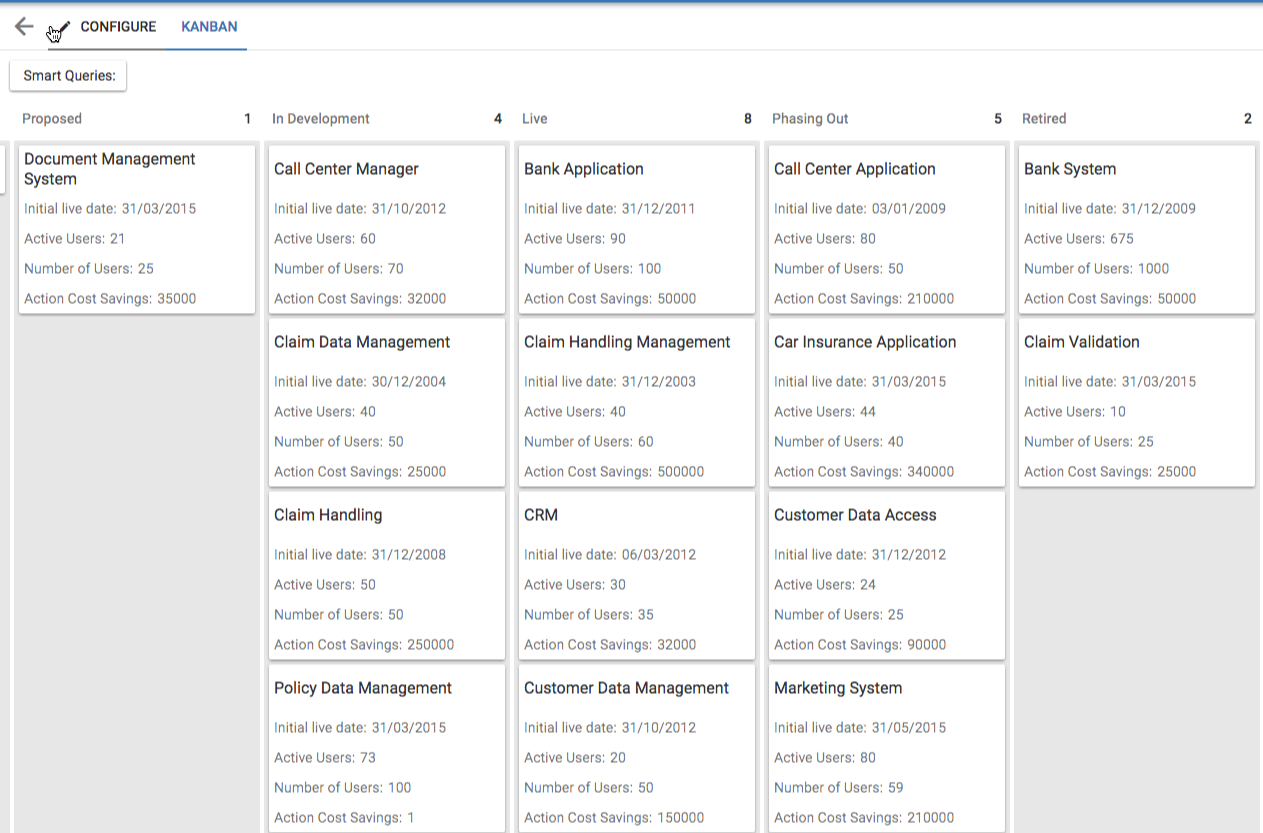
Click the tab with the created visualization name on it to view the kanban.
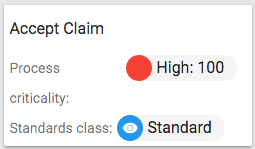
Attribute icons and colours can also be set to show on the cards
The kanban board displays Application components, in stages that represents the value of their Lifecycle status attribute.
Note that the requested Display Attributes are shown on each kanban card.
Open on of the object's edit window, by clicking on its name.
Locate the chosen attribute to see that its value matches its stage name.
Click away from the edit window to close it.
|
|
If the object's card is dragged to a different stage of the Kanban board, the Lifecycle status will be changed. If the Lifecycle status is changed while editing the object, the object's card will be displayed in the appropriate stage of the Kanban board. |
Kanban Grouping
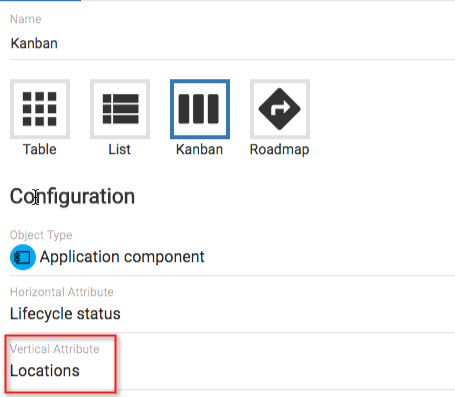
Kanbans can now also be 'grouped', allowing users to select an attribute that cards on the kanban board can be grouped under
Within the visualization, you will see a field called Vertical Attribute - this will present a list of all of the attributes that exist under the chosen object type.
Selecting a value for this attribute will group the cards under matching values...e.g. we may have a relationship list attribute that is called 'Location' and this is set to assign an application object to a location, the cards will be grouped into swimlanes where the Location attribute values match.
Analysis of Objects
Analysis of Objects
Comparisons
Comparisons
Package: Innovation Management
Role Applicable to: Client Administrator, User, Contributor
The compare capability uses a technique known as the Analytic Hierarchy Process (AHP). AHP focuses on group decision making, and is useful where communities can come together to get consensus on a defined goal.
AHP provides a framework for structuring a problem and for relating objects to achieving a goal. The AHP decomposes a problem into a hierarchy, so that it may be easily understood.
The hierarchy then provides a set of individual objects which can be systematically evaluated against each other in turn. This is known as ‘pairwise comparison’. When each of the objects has been evaluated against each other, they are ranked in order of importance of that decision.
The same object can have a different ranking in a different hierarchy. Each hierarchy is represented by a goal that the decision is satisfying, criteria by which alternatives are grouped and alternatives themselves.
Creating a comparison
Firstly, navigate to the comparisons module.
Then press the add button in the bottom left of the list.
Next you will need to fill in the fields on the form:
Name: The name of the comparison
Description: Describe the comparison, maybe add what you aim to achieve?
Goal: The goal object, this can be of any object type but it should be something you wish to achieve.
Criteria: At least one criteria to compare the alternatives against is required although you can have mutliple.
Alternatives: These are the objects that you wish to compare against each other.
Press Save in the bottom right when you've completed the form.
Next to the save button, a new button will appear called Start.
Once you press start the comparison will no longer be able to be modified through the form, but you will be able to begin comparing the objects. Pressing start will give you a warning message to confirm that you won't be able to modify the comparison further. Press OK and the comparison will be created.
Using a comparison
In order to priortize which objects are the most important, objects can be ranked against each other.
Select the Rank tab, choose the criteria and choose the Show/Hide Results option. Perform the comparison of the objects presented.
Ranking is a group activity and all members of a comparison community may rank objects.
The comparison is used to provide a structured framework for quantifying the importance of objects.
The platform helps you systematically evaluate different objects (known as alternatives) by comparing them to one another two at a time, with respect to the criteria that they belong to.
The comparison takes the paired evaluations and compares these over the entire set of pairs. A priority (or rank) is given to each object, with the most important objects have the highest rank.
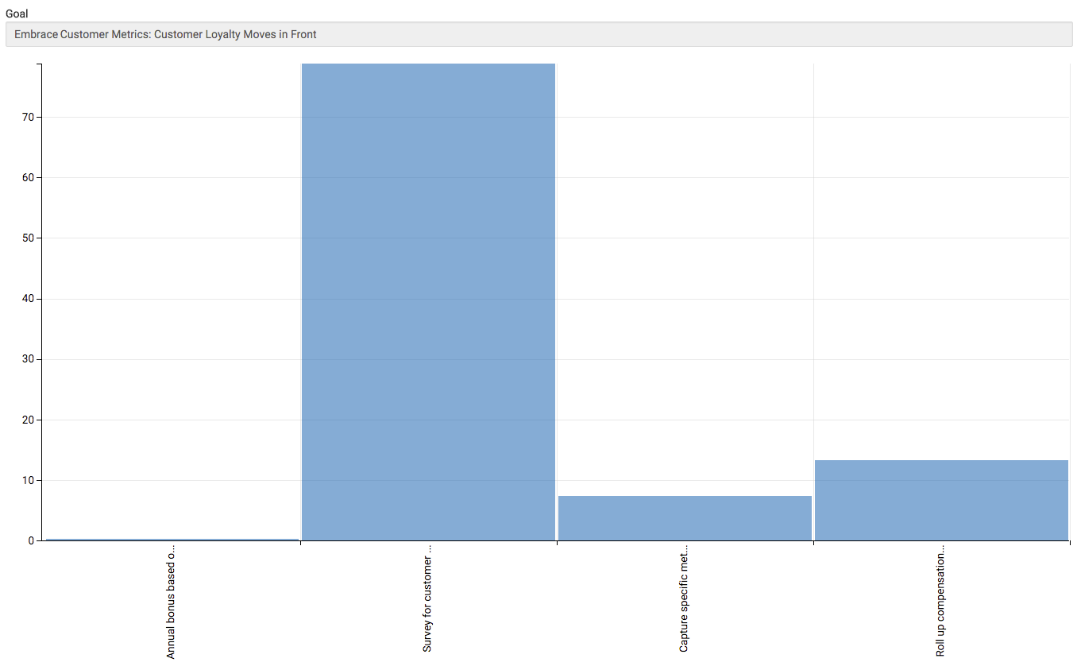
The results of comparisons can be visualized in charts, or as a table.
|
|
The client administrator will have set up comparison sets which represent the goal, criteria, and alternatives. |
|
|
It is expected that ranking of objects takes place at the end of a campaign once all of the objects have been collected. Comparisons cannot have new objects added to them once they have been set up. |
When carrying out a 'pairwise' comparison, use the scale at the bottom of the page to select the object weighting that you prefer.
Slide the slider toward the object that has the highest weighting between the two objects.
Press Save to reveal the next pair to compare.
Once the pairwise comparison is complete, you will receive a completion message and a ranking table will be displayed.
To see the overall rank of the concepts in the comparison, press the comparison tab at the top of the page.
From there you will be able to see a chart of your results.

