
Getting Started
Introducing Foglight for Storage Management
Navigating Foglight for Storage Management
Verifying StorageCollector/Generic SMIS Storage Agents are Collecting Storage Data
Understanding Metric Data in Charts and Tables
Modifying and Extending Data Collection
Next Steps
Monitoring Storage Performance
Introducing the Storage Environment Dashboard
Monitoring Your Storage Environment
Investigating Storage Devices
Understanding Status, Alarms, and Rules in Foglight for Storage Management
Reviewing the Status of All Devices
Assessing Storage Alarms
Monitoring Fabrics
Monitoring Storage Arrays
Monitoring Filers
Asking Questions About the Monitored Storage Environment
Assessing Connectivity and I/O Performance
Introducing the Virtualization Dashboards
Summary of Icons Used in Topology Diagrams
Exploring Connectivity with SAN Topology Diagrams
Exploring I/O Performance with SAN Data Paths
Monitoring Storage Capacity
Capacity Trending
Evaluating Pool Capacity
Environment Summary/Monitoring/Summary
Capacity Reports
Low Capacity Rule
Storage Capacity tab
Creating Storage Reports
Introducing the Storage Explorer
Exploring a Fabric
Exploring a Switch
Exploring a Cisco VSAN
Exploring a Filer
Exploring a Storage Array
Investigating Storage Components
Non-Clustered Storage Arrays
Dell EqualLogic Storage Array
EMC VPLEX Storage Array
EMC Isilon Storage Array
Common Data for Filers and Storage Arrays
Introducing Storage Component Dashboards
Investigating an Aggregate
Investigating an Array/Filer Port
Investigating a Controller
Investigating a Directory
Investigating an EqualLogic Member
Investigating an FC Switch Port
Investigating an Isilon Node
Investigating a LUN
Investigating a NASVolume
Investigating a Physical Disk
Investigating a Pool
Investigating VPLEX Storage
Pool belonging to a non-clustered storage array or EqualLogic storage array
Pool belonging to an Isilon storage array
Common Component Disk Tab Data
Introducing VPLEX Virtualization Components Dashboards
Investigating Director - Ports
Investigating a Virtual Volume
Investigating a Storage Volume
Troubleshooting Storage Performance
Starting a Troubleshooting Investigation
Analyzing Storage Issues
Analyzing the Pool
Changing Latency Thresholds
Understanding the Troubleshooting Algorithm
Managing Data Collection, Rules, and Alarms
Collecting Virtual Storage-to-SAN Relationships
Inferring Physical-Host-to-Storage Relationships
Understanding Metrics
Enabling Dependency Processing
Reviewing and Editing Host-Port Assignments
Running Dependency Processing Manually
Customizing Helper Strings for Dependency Processing
Reviewing Inferred Hosts
Modifying Data Collection Schedules
Understanding Data Collection Types and Schedules
Modifying Data Collection Schedules for Storage Collector Agents
Managing Foglight for Storage Management Rules
Managing Alarm Settings
Troubleshooting Database Limits
Units of Measurement
Performance Metrics
Online-Only Topics
Fabrics and FC Switches — Performance Metrics
Storage Arrays and Filers — Disk I/O Performance Metrics
Clustered Storage Arrays — Network Performance Metrics
Capacity Metrics
Storage Arrays — Array, Member, and Pool Capacity Metrics
Filers — Filer and Aggregate Capacity Metrics
Storage Arrays and Filers — LUN, NASVolume, and Disk Capacity Metrics
Overview of Metrics in Foglight for Storage Management
Investigating an FC Switch Port
|
2 |
Review overall performance in the Summary tab. |
|
• |
Details. Displays the port’s status, physical details, parent switch, parent fabric, VSAN (if applicable), and current values for Data Rate, Frame Rate, Link Error Rate, and Non-Link Error Rate. Click a |
|
• |
Charts. Charts plot the following metric pairs over the time period: |
- Data Rate. Plots values for Data Receive Rate and Data Send Rate.
- Utilization. Plots values for Rcvd Utilization and Xmit Utilization.
- Frame Rate. Plots values for Frame Receive Rate and Frame Send Rate.
- Errors. Plots values for Link Error Rate and Non-Link Error Rate.
- Utilization. Plots values for Rcvd Utilization and Xmit Utilization.
- Frame Rate. Plots values for Frame Receive Rate and Frame Send Rate.
- Errors. Plots values for Link Error Rate and Non-Link Error Rate.
|
• |
Alarm Summary. Displays alarms on the port. |
|
3 |
Click the Topology tab. |
|
• |
Switch-to-Switch Connectivity diagram. Displays the selected ISL port (left box) and its connection to another ISL port (right box). Click a port icon for details about the device connected to the port. |
|
• |
Topology Table (Inter-Switch Connections). Identifies all ISL port connections from this port’s parent switch to other switches in the fabric. |
|
• |
Basic Connectivity (table). Displays the ESX hosts and/or physical hosts connected to the selected N port through their host ports. An N port can have connections to multiple host ports using NPV technology. |
|
TIP: If hosts in the Host Name column are (unknown), you may be able to use dependency processing to infer the host names associated with the host ports. For instructions, see Inferring Physical-Host-to-Storage Relationships. |
|
• |
Basic Connectivity (diagram). Displays the selected N port (left box) and its connection to a filer or storage array port (right box). Click a port icon for details about the device connected to the port. |
|
• |
Select Host Port(s). Controls the set of hosts displayed in the Port Dependencies table. |
|
• |
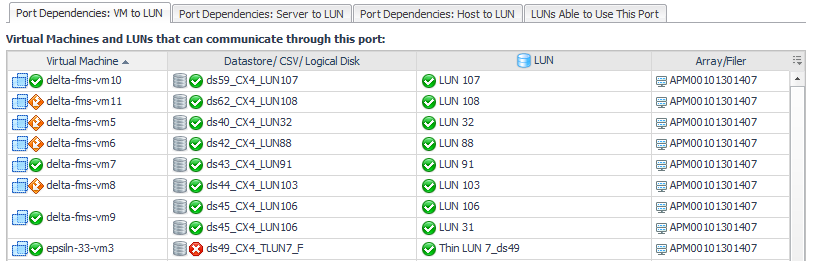
Port Dependencies. On separate tabs, displays connections to LUNs (though the selected port) from virtual machines, ESX or Hyper-V servers, and physical hosts. If the selected port has problems or failures, the connected VMs or hosts may exhibit performance problems. |
Investigating an Isilon Node
|
2 |
Review overall performance in the Summary tab. |
|
• |
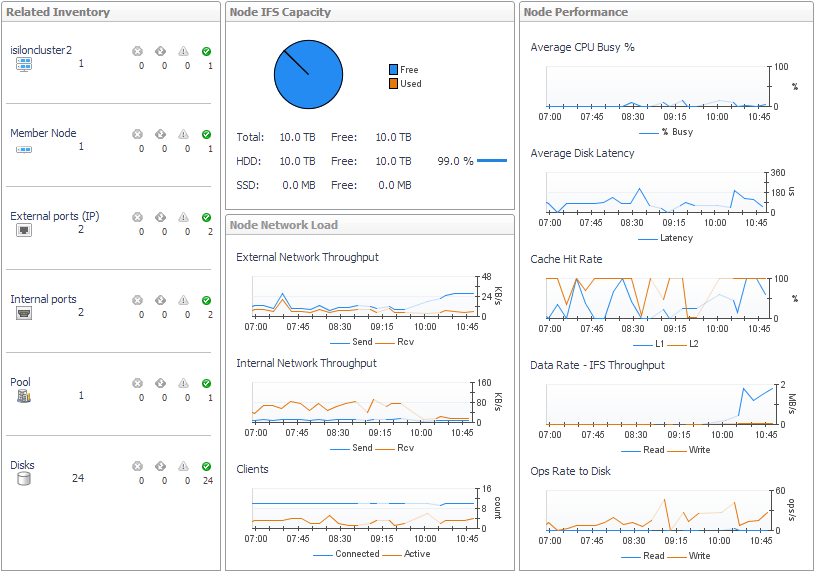
Related Inventory. Displays a list of components from the perspective of the member node (rather than the storage array). |
|
• |
IFS Capacity. The chart displays IFS Capacity: Free and IFS Capacity Used for the IFS file system. In addition, the total capacity is broken down into hard disk drive and solid state drives metrics as follows: |
- Total. IFS Capacity: Total and IFS Capacity: Free
- HDD. IFS Capacity: HDD Total and IFS Capacity: HDD Free
- SSD. IFS Capacity: SDD Total and IFS Capacity: SDD Free
- HDD. IFS Capacity: HDD Total and IFS Capacity: HDD Free
- SSD. IFS Capacity: SDD Total and IFS Capacity: SDD Free
|
• |
Node Network Load. Charts plot the following metric pairs: |
- External Network Throughput. Plots the Send Data Rate and Rcv Data Rate for the external network over the time period.
|
TIP: If you prefer to see the Send Util (% of max) and Rcv Util (% of max) based on the rated maximum speeds of the ports (actual port speeds are not available from Isilon arrays) in the external network, ask your Foglight for Storage Management Administrator to edit the registry variable StSAN_StoragePortShowUtilMax and set ISLN_E_IP=true. |
- Internal Network Throughput. Plots values for Send Data Rate and Rcv Data Rate.
- Clients. Clients connected versus clients that are actively using the network.
- Clients. Clients connected versus clients that are actively using the network.
|
• |
Node Performance. Charts plot the following metrics for the selected node over the time period: % Busy, Latency, L1 Cache Hit Rate, L2 Cache Hit Rate, Data Read Rate, Data Write Rate, Read Ops Rate, and Write Ops Rate. |
|
• |
Summary and Resource Information. Displays physical details about the member node. |
|
• |
Alarm Summary. Displays alarms on the member node. |
|
3 |
Click the Network tab. |
Displays the same information as the Network tab on the Isilon Storage Array dashboard, but the data reflects only the selected member node. For more information, see EMC VPLEX Storage Array.
|
4 |
Click the Disks tab. |
Displays disks used by the selected member. For more information, see Common Component Disk Tab Data.
Investigating a LUN
|
2 |
Review overall performance in the Summary tab. |
|
• |
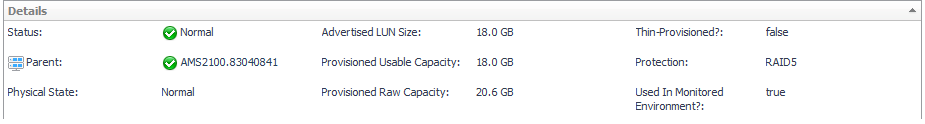
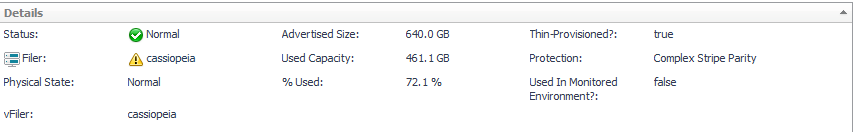
Details. Displays the LUN’s status, physical details, parent device and capacity metrics. |
|
• |
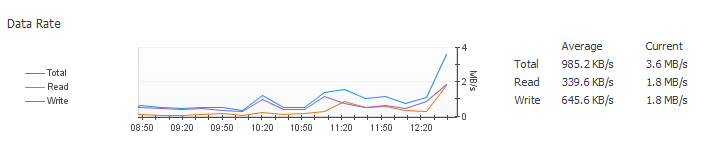
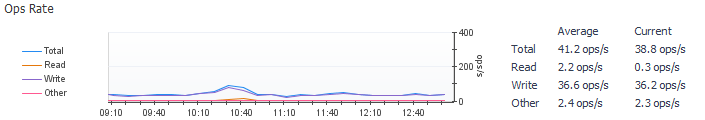
Charts. Plot values over the time period for these metrics, if available: Ops Rate, Data Rate, Latency, % Busy, Cache Hit Rate, and Average Queue Depth. |
|
• |
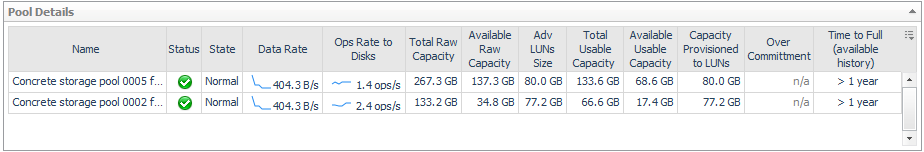
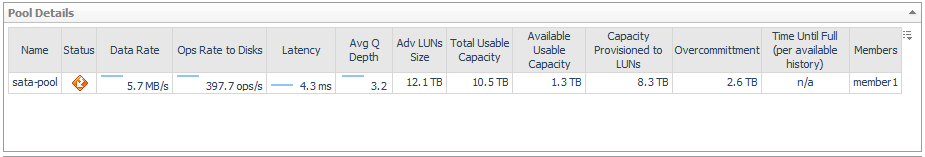
Pool Details. Identifies the pools to which the LUN belongs. |
Non-clustered storage arrays — Displays performance and capacity metrics for the pools relevant to the selected LUN. For more information, see Performance Metrics and Capacity Metrics.
EqualLogic storage arrays—Displays the same information as the Pool Details view on the Pools-Members tab of the EqualLogic Storage Array dashboard, but the data reflects only the pools relevant to the selected LUN. For more information, see Dell EqualLogic Storage Array.
|
• |
Alarm Summary. Displays alarms on the LUN. |
|
3 |
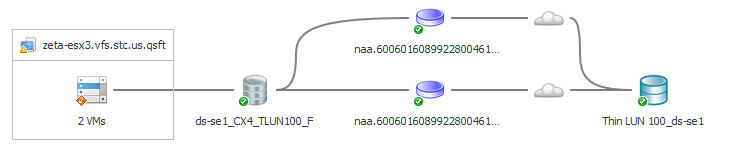
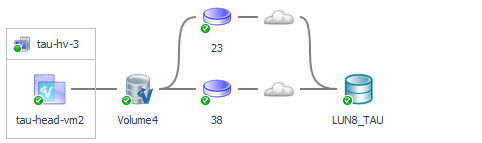
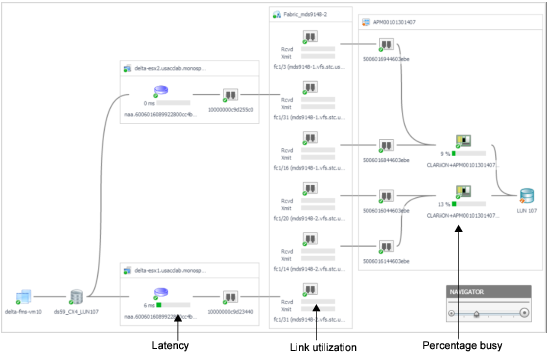
Click the Topology tab. |
Displays the datastores, CSVs, or logical disks that get their physical storage from the selected LUN, the VMs that do the I/O, and if dependency processing is enabled, the (most likely) physical host connected to the LUN. For more information on dependency processing, see Inferring Physical-Host-to-Storage Relationships.
|
• |
Click a |
|
4 |
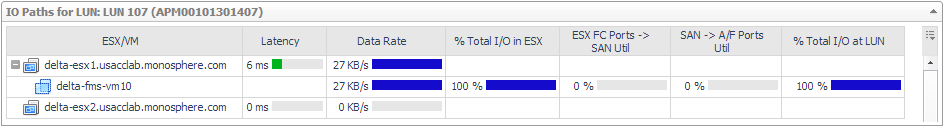
Click the SAN Data Paths tab. |
|
TIP: For metrics that have thresholds, the color of the bars highlight data values that fall within normal, warning, critical, and fatal thresholds.Thresholds are set in the registry variables StSAN.FCSwitchPortUtilization.[Warning|Critical|Fatal]. |
|
• |
ESX/VMs or Hyper-V Server/VM. List of servers and the VMs they host. |
|
• |
Latency. Average latency per operation in the time period. |
|
• |
Data Rate. Average data rate for I/O from the ESX or VM to the LUN over the time period. |
|
• |
% Total I/O in ESX or % Total I/O in Hyper-V Server. When multiple VMs on a server are performing I/O to the same LUN, displays the percentage of the total I/O performed by this VM. |
|
• |
ESX FC Ports --> SAN Util or Hyper-V Server FC --> Ports SAN Util. Displays the busiest link (read or write utilization) over a time period. Click the cell to display all the port links. Review the topology diagram to see the ports and link utilization. Data is not available for IP ports. |
|
• |
SAN --> A/F Ports Util. Displays the busiest link (read or write utilization) over the time period. Click the cell to display all the port links. Review the topology diagram to see the ports and link utilization. Data is not available for IP ports. |
|
• |
% Total I/O at LUN. When VMs on multiple servers are doing I/O to the same LUN, displays the percentage of the total I/O performed by this server. |
|
• |
LUN Latency (ms). Displays the latency of LUN in ms. |
|
• |
Click a host, VM, or virtual storage name or icon. See the Managing Virtualized Environments User and Reference Guide. |
Investigating a NASVolume
|
2 |
Review overall performance in the Summary tab. |
|
• |
Details. Displays the volume’s status, physical state, physical details, parent devices, and alarms on disks in the volume. Also displays current values for Advertised NASVolumes Size, Used Capacity, and % Used. |
|
• |
Charts. Displays the following metrics over the time period: |
- Data Rate. Plots values for Data Read Rate and Data Write Rate.
- Ops Rate. Plots values for Read Ops Rate, Write Ops Rate and Other Ops.
- Latency. Plots values for Read Latency and Write Latency.
- Ops Rate. Plots values for Read Ops Rate, Write Ops Rate and Other Ops.
- Latency. Plots values for Read Latency and Write Latency.
|
• |
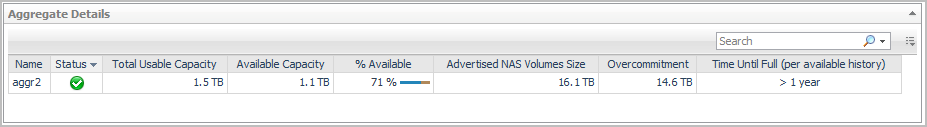
Aggregate Details. Displays values for Total Usable Capacity, Available Usable Capacity % Available, Advertised NASVolumes Size, and Overcommitment. |
|
• |
Alarm Summary. Displays alarms on the NASVolume. |
|
3 |
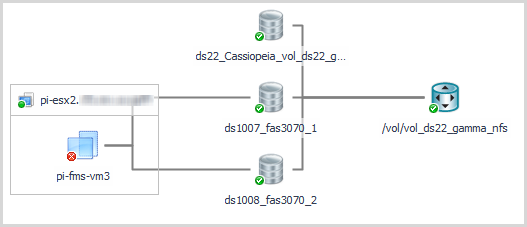
Click the Topology tab. |
Displays the datastores that get their physical storage from the selected volume as a NAS mount and the VMs that do I/O to these datastores. For more details, click an icon or an entity name. For more information about using this view, see Exploring Connectivity with SAN Topology Diagrams.
|
4 |
Click the Disks tab. |
|
• |
Click a host, VM, or datastore name or icon. See the Managing Virtualized Environments User and Reference Guide. |