|
2 |
Review overall performance in the Summary tab. |
|
• |
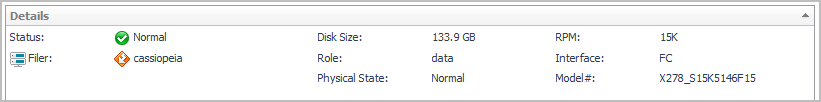
Disk Details. Displays the disk’s status, physical details, parent device, and size if available. |
|
• |
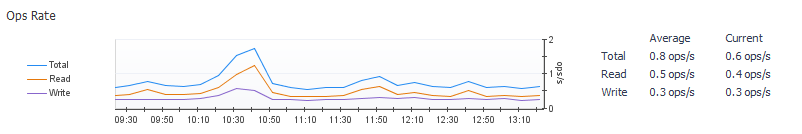
Charts. Displays the following metrics over the time period: |
|
• |
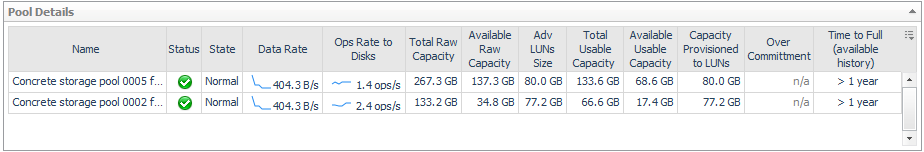
Pool Details (Arrays only). Displays performance and capacity metrics for the pools to which this disk contributes resources. For more information, see Performance Metrics and Capacity Metrics. To investigate a pool, click its name. For more information, see Investigating a Pool. |
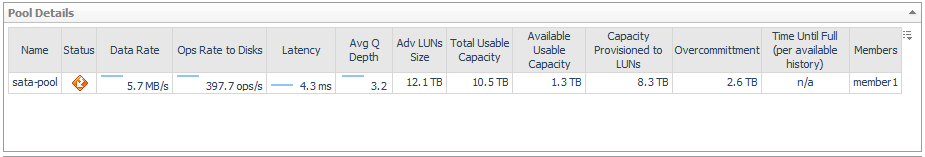 Isilon storage arrays—Displays the same information as the Pool Details view on the Pools tab of the Isilon Storage Array dashboard, but the data reflects only the pools relevant to the selected disk. For more information, see EMC VPLEX Storage Array.
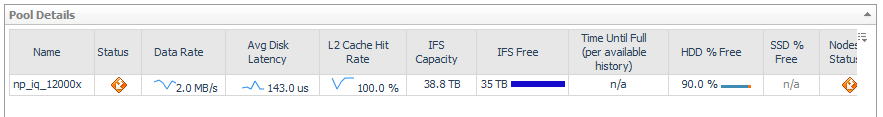
|
• |
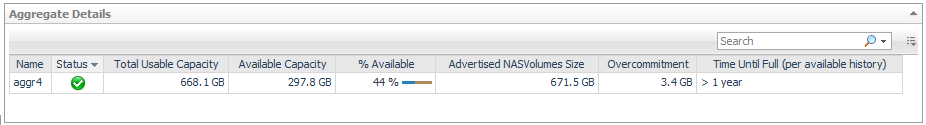
Aggregate Details (Filers only). Lists the aggregates to which this disk contributes resources. For each aggregate, displays its name, status, physical state, and current values for Total Usable Capacity, Available Usable Capacity % Available, Advertised NASVolumes Size, and Overcommitment. To investigate an aggregate, click its name. See Investigating an Aggregate. |
|
• |
Alarm Summary. Displays alarms on the disk. |
|
2 |
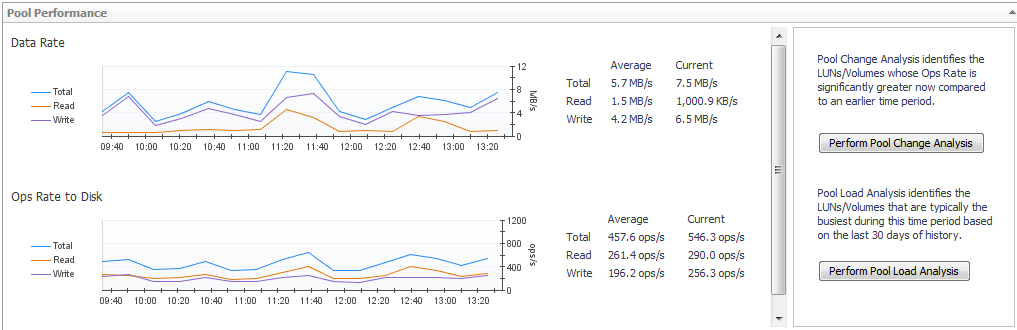
Review overall performance in the Summary tab. From here you can initiate further analysis of the pool in terms of performance and, in some cases, pool capacity. |
|
• |
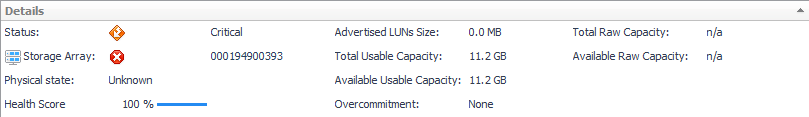
Details. Displays the pool’s status, parent storage array, physical state, health score, and current values for Total Advertised LUNs Size, Total Usable Capacity, Available Usable Capacity, Overcommitment, Total Raw Capacity, and Available Raw Capacity, if available. |
|
• |
Charts. Displays the following sets of metrics over the time period, if available: |
|
• |
Perform Pool Change Analysis. Click to identify the LUNs primarily responsible for increased I/O. For more information, see Analyzing the Pool. |
|
• |
Perform Pool Load Analysis. Click to identify the busiest LUNs, and rank them based on their activity during the same time range over the last 30 days. For more information, see Analyzing the Pool. |
|
• |
Alarm Summary. Displays alarms on the pool. |
|
3 |
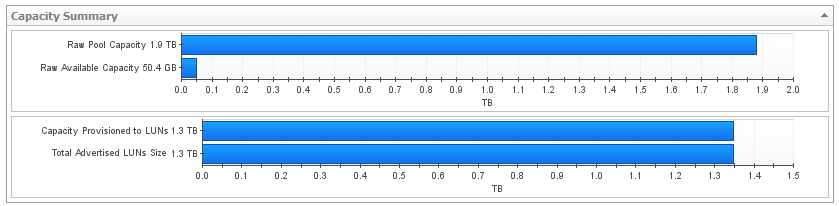
Click the Capacity tab. |
|
• |
Capacity Summary. Pools in most arrays will display data similar to the data shown below. 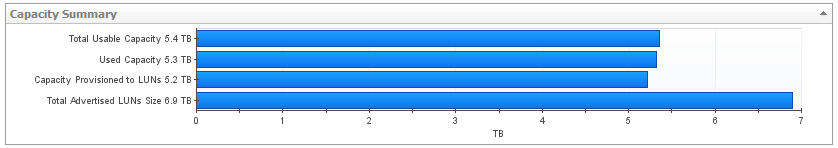 |
|
• |
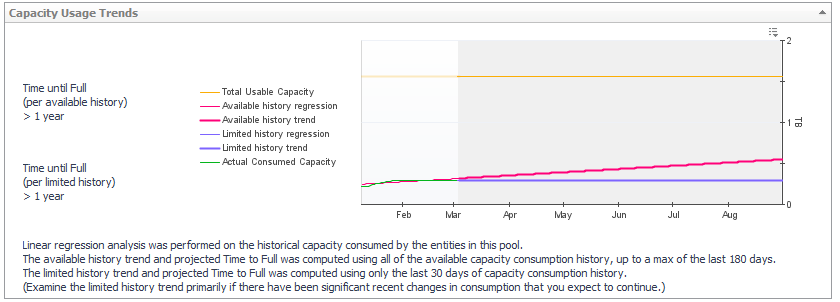
Capacity Usage Trends. Provides a visual display of the estimated capacity consumption in the future, based on a regression analysis of the historical capacity consumption. |
|
4 |
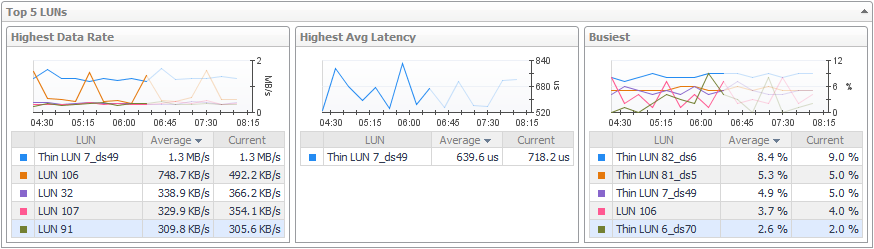
Click the LUNs tab. This tab displays the LUNs carved from this pool. |
|
• |
Top 5 LUNs. Displays the top five LUNs with the highest average value for Data Rate, and the performance metrics most useful for this array or filer. |
|
• |
LUN Status Filter. Click to show only LUNs with the selected status in the LUN Details table. |
|
• |
LUN Details. For each LUN, displays its status, physical state, parent pool or aggregate, and whether the LUN is used by an entity in the monitored environment. The metric columns display current values for Data Rate, Ops Rate, Latency, % Busy, Average Queue Depth, L1 Cache Hit Rate, and Total Advertised LUNs Size. Click a |
|
• |
Alarm Summary. Displays alarms on LUNs. |
|
5 |
Click the Disks tab. |
|
2 |
Review overall performance in the Summary tab. |
|
• |
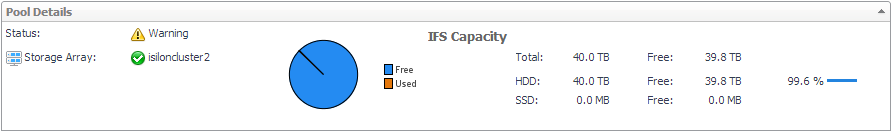
Pool Details. Displays the pool’s status, parent storage array, and current values for IFS Capacity: Free and IFS Capacity Used for the IFS file system. In addition, the total capacity is broken down into hard disk drive and solid state drives metrics as follows: |
|
• |
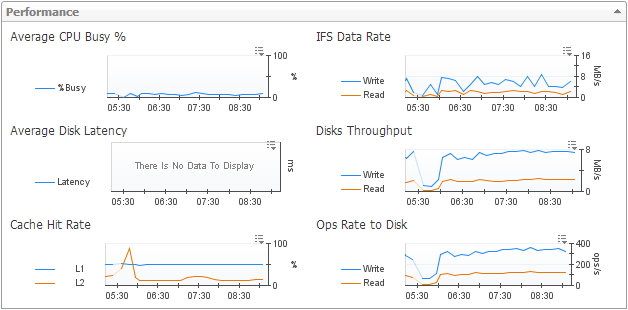
Performance. Charts plot the following metrics for the selected pool over the time period: % Busy, Latency, L1 Cache Hit Rate, L2 Cache Hit Rate, Data Read Rate, Data Write Rate, Read Ops Rate, and Write Ops Rate. |
|
• |
Node Status Filter. Click to show only member nodes with the selected status in the Node Details table. |
|
• |
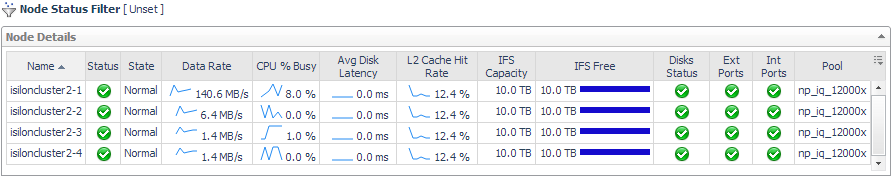
Node Details. For each node belonging to the pool, displays its name, status, physical state, and current values for Data Rate, % Busy, Latency, L2 Cache Hit Rate, IFS Capacity, and IFS Capacity: Free. Also displays the worst status of the node’s disks, external network ports, and internal network ports, and identifies the node’s parent pool. Click a |
|
• |
Alarm Summary. Displays alarms on the pool. |
|
3 |
Click the Capacity tab. |
|
• |
Capacity Usage Trends. Provides a visual display of the estimated capacity consumption in the future, based on a regression analysis of the historical capacity consumption. |
|
4 |
Click the Network tab. Assess the performance of the ports in the External Network from the perspective of the pool. |
|
• |
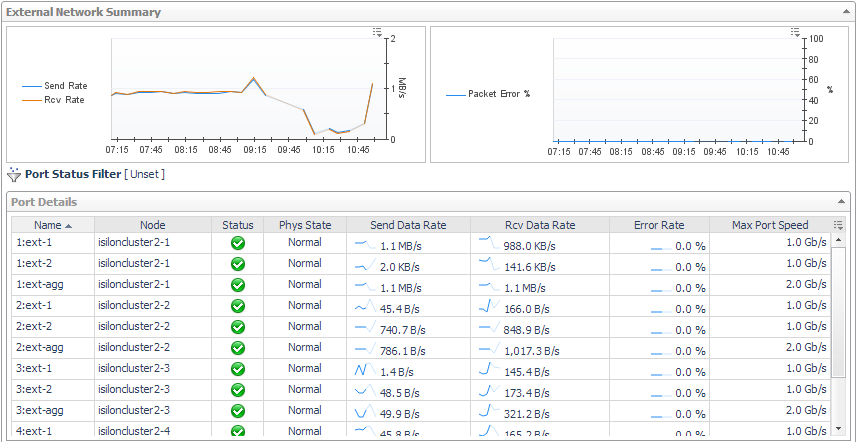
Charts. Plot aggregated values for Send Data Rate and Rcv Data Rate, and Packet Errors % for the external network connections over the time period. |
|
• |
Port Status Filter. Click to show only ports with a selected status in the Port Details table. |
|
• |
Port Details. For each port used by the external network, identifies the port name, parent node, status, physical state, and current values for Send Data Rate, Rcv Data Rate, and Packet Errors %. Also displays the maximum speed of the port. Click a |
|
NOTE: When the registry variable StSAN_StoragePortShowUtilMax is set to show port utilization, the chart and table display Rcv Util (% of max) and Send Util (% of max). |
|
• |
Alarm Summary. Displays alarms on ports used by the external network. |
|
5 |
Click the Disks tab. Displays the disks used by the selected pool. For more information, see Common Component Disk Tab Data. |