|
1 |
On the navigation panel, under Dashboards, click Storage & SAN > Storage Explorer. |
|
2 |
On the navigation panel, under Topology, expand Fabrics and select a fabric. |
|
3 |
If the Alarm Count displays alarms, you may want to assess the alarms before continuing with this walkthrough. Click a status count to open a list of device and component alarms. For more information, see Assessing Storage Alarms. |
|
4 |
In the Summary tab, review performance in terms of key metrics. |
|
• |
Summary and Resource Information. Displays physical details about the fabric. |
|
• |
FC Switch Detail. For each switch, displays the switch status, type of switch (physical or logical), and current value for Data Rate, followed by details about the ISL ports and N ports belonging to the switch. Ports details include the number of ports by alarm status and current values for Link Error Rate and Non-Link Error Rate. Click a |
|
• |
Alarm Summary. Displays alarms on this fabric. |
|
5 |
Click the ISL Ports tab. |
|
• |
Highest charts. The charts display the top three ISL ports in the fabric with the highest average Data Rate, Link Error Rate, and Non-Link Error Rate, respectively. The tables show the average and current values for the ports. |
|
• |
Topology Table (Inter-Switch Connections). For each switch, identifies all ISL port connections with other switches in the fabric. |
|
• |
Port Details. For each switch-plus-port combination, displays the name and type of switch (physical or logical) and the port name, status, and physical state. The metrics represent current values for Rcvd Utilization, Xmit Utilization, Link Error Rate, Non-Link Error Rate, and Link Speed. Click a |
|
• |
Alarm Summary. Displays alarms on ISL ports. |
|
6 |
Click the N Ports tab. |
|
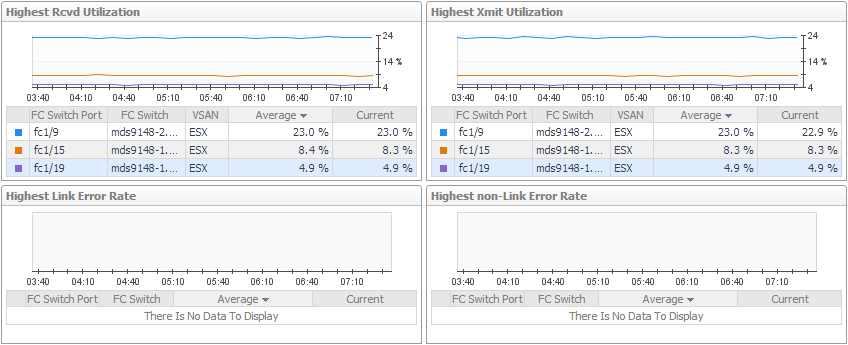
• |
Highest charts. The charts display the top three N ports in the fabric with the highest average Rcvd Utilization, Xmit Utilization, Link Error Rate, and Non-Link Error Rate, respectively. The tables show the average and current values for the ports. |
|
• |
Port Details. For each switch-plus-port combination, displays the name and type of switch and the port name, status, and physical state. The metrics represent current values for Rcvd Utilization, Xmit Utilization, Link Error Rate, Non-Link Error Rate, and Link Speed. Click a |
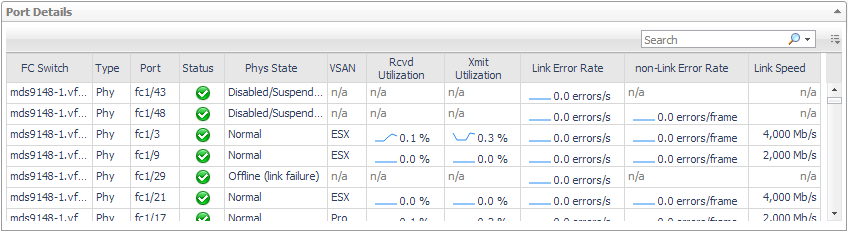
|
• |
Alarm Summary. Displays alarms on N ports. |
|
• |
|
1 |
On the navigation panel, under Dashboards, click Storage & SAN > Storage Explorer. |
|
2 |
On the navigation panel, under Topology, expand Fabrics, expand the target fabric, and select a switch. |
|
3 |
If the Alarm Count displays alarms, you may want to assess the alarms before continuing with this walkthrough. Click a status count to open a list of device and component alarms. For more information, see Assessing Storage Alarms. |
|
4 |
In the Summary tab, review performance in terms of key metrics. |
|
• |
Summary and Resource Information. Displays physical details about the switch. |
|
• |
Topology Table (Inter-Switch Connections). Brocade logical switches only. For each switch, identifies all ISL port connections with other switches in the fabric. |
|
• |
Alarm Summary. Displays alarms on the switch. |
|
5 |
Click the ISL Ports tab, if available. |
|
6 |
Click the N Ports tab. |
|
• |
|
1 |
On the navigation panel, under Dashboards, click Storage & SAN > Storage Explorer. |
|
2 |
On the navigation panel, under Topology, expand Fabrics, expand a Cisco fabric with VSANs, and select a VSAN. |
|
3 |
If the Alarm Count displays alarms, you may want to assess the alarms before continuing with this walkthrough. Click a status count to open a list of device and component alarms. For more information, see Assessing Storage Alarms. |
|
4 |
In the Summary tab, review performance in terms of key metrics. |
|
5 |
Click the ISL Ports tab. |
|
6 |
Click the N Ports tab. |
Foglight for Storage Management supports NetApp filers. NetApp uses the word aggregate instead of pool, but the metrics collected for aggregates and pools are similar. In some filer views, in particular the views on the LUNs tab and Disks tabs, the word pool may be displayed instead of aggregate, but in this context it refers to aggregates.
|
1 |
On the navigation panel, under Dashboards, click Storage & SAN > Storage Explorer. |
|
2 |
On the navigation panel, under Topology, expand Filers and select a filer. |
|
3 |
In the Summary tab, review performance in terms of key metrics. |
|
• |
Summary and Resource Information. Displays physical details about the filer. |
|
• |
Alarm Summary. Displays alarms on the filer. |
|
4 |
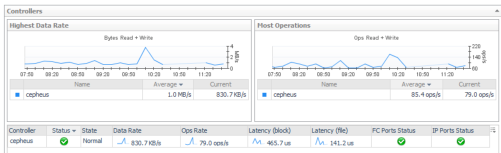
Click the Controllers-Ports tab. |
|
• |
Controllers. The charts display the controllers with the highest average Data Rate and Ops Rate. The table displays current values for each of the charted metrics, plus Latency by block and file and the most severe alarm status on the FC ports and IP ports associated with this controller. |
|
• |
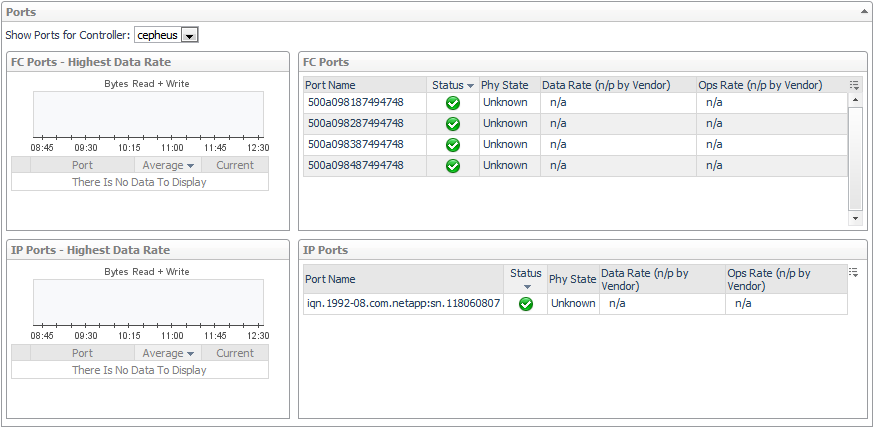
Ports. Select a controller from the Show Ports for Controller list. The ports associated with the selected controller are displayed, however the port’s physical state and performance metrics are unavailable for NetApp filers. The IP ports shown are used for iSCSI I/O to LUNs traffic. |
|
• |
Alarm Summary. Displays alarms on controllers and ports. |
|
6 |
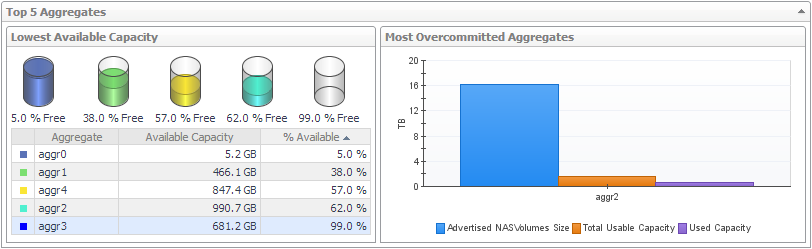
Click the Aggregates tab. |
|
• |
Lowest Available Capacity. Displays the five aggregates with the lowest average value for Available Usable Capacity over the time period. |
|
• |
Most Overcommitted Aggregates. Identifies up to five of the most overcommitted aggregates, and displays current values for Advertised NASVolumes Size, Total Usable Capacity, and Used Capacity. |
|
• |
Aggregate Details. For each aggregate, displays the aggregate name, status, and current values for Total Usable Capacity, Available Usable Capacity, % Available, Advertised NASVolumes Size, and Overcommitment. |
|
• |
Alarm Summary. Displays alarms on aggregates. |
|
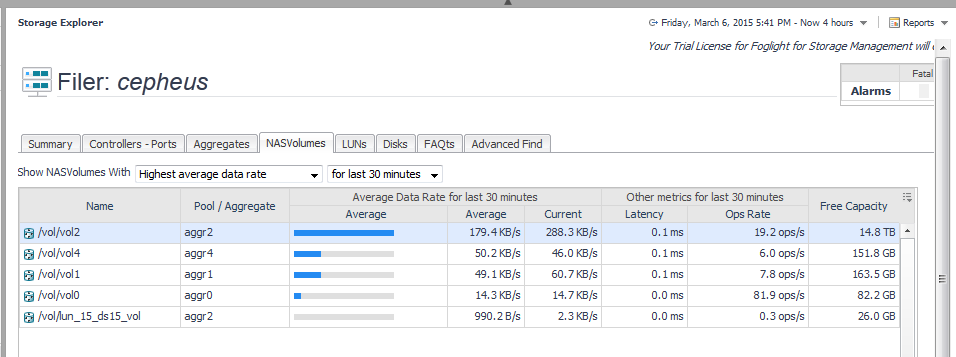
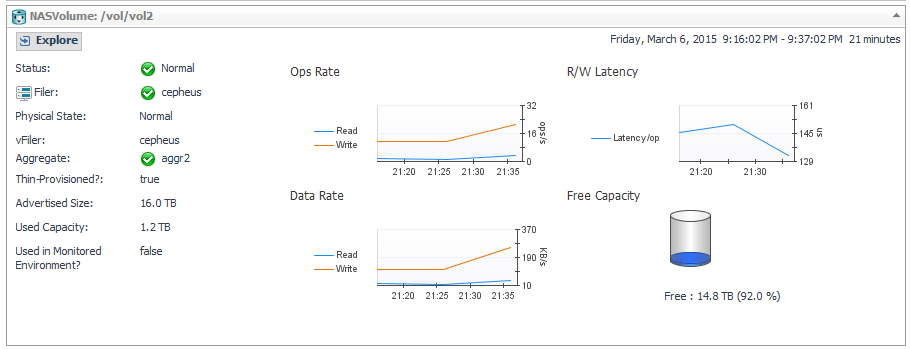
7 |
Click the NASVolumes tab. |