Chat now with support
Chat with Support

Foglight for Storage Management Shared 4.6 - User and Reference Guide

Getting Started Monitoring Storage Performance Investigating Storage Devices Investigating Storage Components Investigating VPLEX Storage Troubleshooting Storage Performance Managing Data Collection, Rules, and Alarms Understanding Metrics Online-Only Topics

Overview of Metrics in Foglight for Storage Management

Metrics and data are saved in the Foglight for Storage Management database as properties of topology objects. Topology objects correspond to the types of storage devices and components being monitored in your storage environment.

Summary of SAN Topology Objects

If you want to create new rules or custom dashboards, or if you want to browse the data directly instead of through the Storage & SAN dashboards, you need to know the names of devices, components, and metrics as they are stored in the Foglight for Storage Management Database Repository.

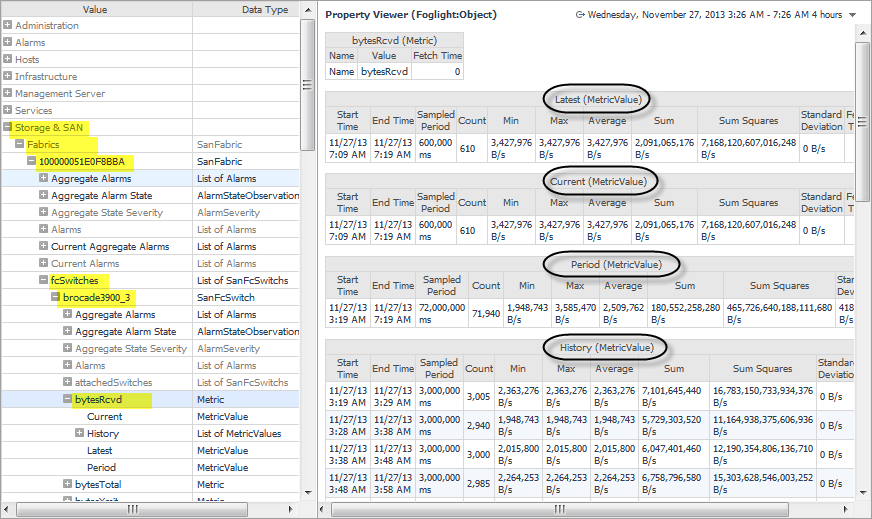
The following tables list the top-level storage devices and all child components, and identifies their topology object names. These lists are not comprehensive, rather they reflect the objects that you may need to reference if you are creating new rules or custom dashboards. For other objects, see the Data dashboard. For help navigating to the Data dashboard, see Locating SAN Topology Objects in Foglight for Storage Management.

SanFabric

SanFcSwitch

SanVsan

SanFiler

SanStorageArray

SanFcSwitchPort

SanStorageSupplierPortFC

SanStorageSupplierPortISCSI

SanStorageSupplierPortIB

SanController

SanPhysicalDisk

SanLun

SanMember

SanVolume

SanPool

SanStorageVirtualMachine

SanLogicalInterface

Locating SAN Topology Objects in Foglight for Storage Management

NOTE: You require the Foglight for Storage Management role Administrator to access the Configuration > Data menu.

You can explore directly the metrics and data captured for monitored storage devices and their components. Data is displayed as a hierarchy of objects.

2
Expand the Storage & SAN branch.
For example, the following image shows a selected FC Switch (brocade3900_3). The Data Rate metric, which is called bytesRcvd, is selected and displayed in the Property Viewer. The Property Viewer contains tables showing all collected values for the selected metric. For more information, see Understanding Metric Data in Charts and Tables.
Figure 10. Property Viewer


Online-Only Topics

Use this dashboard to identify poorly-performing devices, investigate alarms, and begin investigating the issues that are contributing to problems.

Administration. Managing Data Collection, Rules, and Alarms (displayed when users have the Storage Administrator role)
Getting Started. For purchasing licenses only (displayed when users have the Storage Administrator role)
Related Documents

The document was helpful.

Select Rating

I easily found the information I needed.

Select Rating