The tabs displayed on the dashboard differ depending on the selected storage array:
|
• |
Non-Clustered Storage Arrays (supported storage arrays except EqualLogic and Isilon) |
Most supported storage arrays are displayed as described in this walkthrough. If you are using Dell EqualLogic arrays, EMC Isilon arrays, or EMC VPLEX arrays, see Dell EqualLogic Storage Array, EMC Isilon Storage Array, or EMC VPLEX Storage Array instead.
|
1 |
On the navigation panel, under Dashboards, click Storage & SAN > Storage Explorer. |
|
2 |
On the navigation panel, under Topology, expand Storage Arrays and select a storage array. |
|
3 |
If the Alarm Count displays alarms, you may want to assess the alarms before continuing with this walkthrough. Click a status count to open a list of device and component alarms. For more information, see Assessing Storage Alarms. |
|
4 |
In the Summary tab, review performance in terms of key metrics. |
|
• |
Summary and Resource Information. Displays physical details about the storage array. |
|
• |
Alarm Summary. Displays alarms on the storage array. |
|
5 |
Click the Controllers-Ports tab. |
|
• |
Controllers. The charts display the controllers with the highest average Data Rate, Ops Rate, and % Busy, if available. The table displays current values for each of the charted metrics, plus Latency if available, and the most severe alarm status on the FC ports and IP ports associated with this controller. |
|
• |
Ports. Select a controller from the Show Ports for Controller list. The chart will display port utilization distribution, if the array provides the operating link speed of the ports. Otherwise, the Data Rate of the 3 busiest ports will be displayed. The tables will display all available current metrics for each port. |
|
6 |
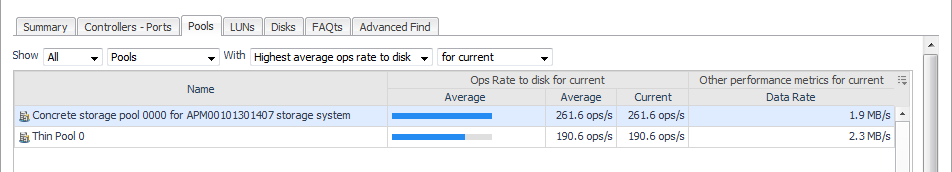
Click the Pools tab. |
|
• |
Show Top 15/All Pools/Pools w Thin LUNs With … This view lets you quickly see the top fifteen or all LUNs with a selected metric, averaged over the selected time period. The performance metrics that may be available for selection, depending on the array type, include: |
|
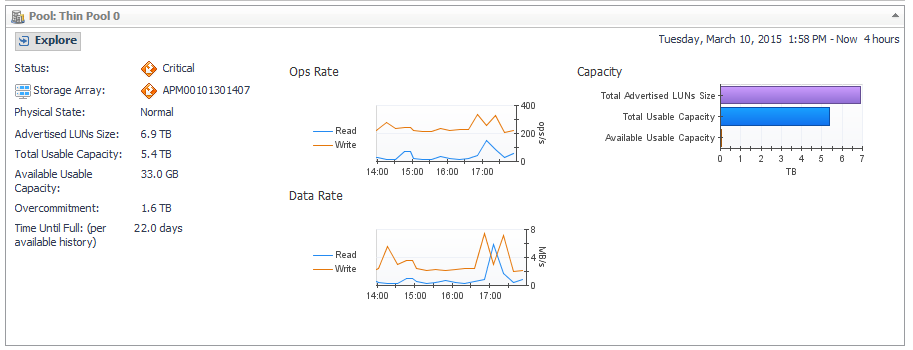
NOTE: Selecting Pools w Thin LUNs is useful for monitoring Pools whose available capacity can change quickly because it contains thin-provisioned LUNs. |
|
• |
Alarm Summary. Displays alarms on pools. |
|
9 |
Click the Advanced Find tab to investigate a LUN or Disk that is not included in the Top 15 items on the LUNs or Disks. Use the Advanced Find functionality to query for the desired items. For more information, see Advanced Find. |
Foglight for Storage Management monitors Dell EqualLogic array groups. In the interface, groups are categorized as Storage Arrays, and array members are called Member Nodes or simply Members.
|
1 |
On the navigation panel, under Dashboards, click Storage & SAN > Storage Explorer. |
|
2 |
On the navigation panel, under Topology, expand Storage Arrays and select an EqualLogic group. |
|
3 |
If the Alarm Count displays alarms, you may want to assess the alarms before continuing with this walkthrough. Click a status count to open a list of device and component alarms. For more information, see Assessing Storage Alarms. |
|
4 |
In the Summary tab, review performance in terms of key metrics. |
|
• |
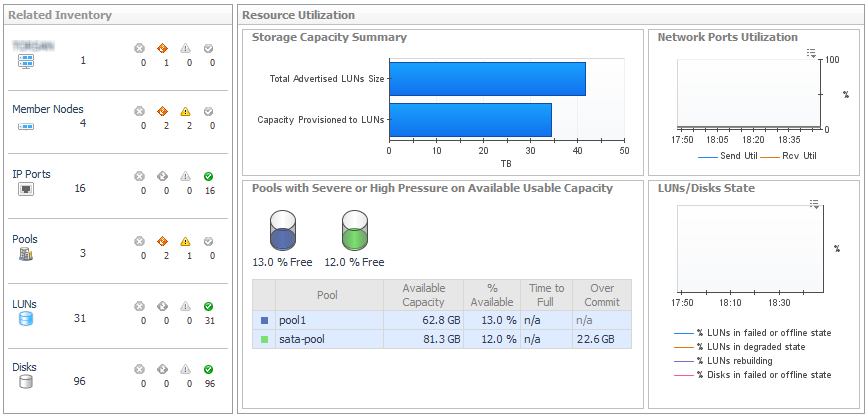
Related Inventory. Contains alarm summaries for the selected storage array and its member nodes, IP ports, pools, LUNs, and disks. |
|
• |
Storage Capacity Summary. Displays current values for Total Advertised LUNs Size and Capacity Provisioned to LUNs. |
|
• |
Network Ports Utilization. Plots aggregated current values for Send Util and Rcv Util over the time period. |
|
• |
LUNs/Disks States. Plots the percentage of disks and LUNs in the storage array in problem states. Problem states are reported by the vendor. Resolving these issues may improve LUN performance. |
|
• |
Summary and Resource Information. Displays physical details about the storage array. |
|
• |
Alarm Summary. Displays alarms on the storage array. |
|
5 |
Click the Network tab. |
|
• |
Network Summary. Identifies the load on the network, in terms of Send Util and Rcv Util, and the Packet Errors % over the time period. |
|
• |
Port Status Filter. Click to show only ports with the selected status in the Port Details table. |
|
• |
Port Details. For each member-plus-port combination, displays current values for Data Rate, Send Util, Rcv Util, Packet Errors %, and Link Speed. Click a |
|
• |
Alarm Summary. Displays alarms on ports. |
|
6 |
Click the Pools-Members tab. |
|
• |
Highest charts. Display the pools with the highest average value for Ops Rate and Latency. Also shows aggregated values for Total Advertised LUNs Size and Capacity Provisioned to LUNs for all members. |
|
• |
Pool Details. For each pool, displays its name, status, and current values for Data Rate, Ops Rate, Latency, Average Queue Depth, Total Advertised LUNs Size, Total Usable Capacity, Available Usable Capacity, Capacity Provisioned to LUNs, and Overcommitment. Click a |
|
• |
Member Details. For each member, displays its name, parent pool, status, and current values for Data Rate, Ops Rate, Latency, Send Util, Rcv Util, Total Usable Capacity, % Used, and % of Pool. Also displays the RAID level in use for the member. |
|
• |
Alarm Summary. Displays alarms on pools and members. |
|
10 |
Click the Advanced Find tab to investigate a LUN or Disk that is not included in the Top 15 items on the LUNs or Disks. Use the Advanced Find functionality to query for the desired items. For more information, see Advanced Find. |
Foglight for Storage Management monitors EMC VPLEX clusters. In the interface, clusters are categorized as Vplex Clusters.
|
1 |
On the navigation panel, under Dashboards, click Storage & SAN > Storage Explorer. |
|
2 |
On the navigation panel, under Topology, expand VPlex Clusters and select a VPLEX cluster. |
|
3 |
If the Alarm Count displays alarms, you may want to assess the alarms before continuing with this walkthrough. Click a status count to open a list of device and component alarms. For more information, see Assessing Storage Alarms. |
|
4 |
In the Summary tab, review performance in terms of key metrics. |
|
• |
Related Inventory. Contains alarm summaries for the selected cluster and its directors, frontend ports, backend ports, virtual volumes, storage volumes, storage arrays, and fabrics. |
|
• |
Top directors charts. Lists top 3 directors by CPU usage, Heap Usage, Data Rate and Ops. |
|
• |
Engine Information. Displays physical details about the VPLEX array. |
|
• |
Alarm Summary. Displays alarms on the VPLEX array. |
|
5 |
Click the Storage Volumes tab. |
|
• |
Top 5 Storage Volumes. Lists top 5 storage volumes of highest average latency. |
|
• |
Storage Volumes Status Filter: Click to show only storage volumes with the selected status in the Storage Volumes Detail table. |
|
• |
Storage Volumes Detail table. For each storage volume, displays its name, status, IO status, Operational Status, Source, Capacity, Latency, and LUN used by this storage volume. |
|
• |
Alarm Summary. Displays alarms on the Storage Volume. |
|
6 |
Click the Directors - Ports tab. |
|
• |
Top 3 Directors. Displays the top three back-end/front-end directors with the highest average value for Data Rate, Operations, and Errors. The charts plot values over the time period, while the tables show the average and current values for each director. |
|
• |
Top 3 Ports. Displays the top three back-end/front-end ports with the highest read and writer bytes. The charts plot values over the time period, while the tables show the average and current values for each port. |
|
• |
Alarm Summary. Displays alarms on directors. |
|
7 |
Click the Virtual Volumes tab. |
|
• |
Top 5 Virtual Volumes. Displays the top five virtual volumes by Data Rate, Average Latency and Ops Rate. |
|
• |
Virtual Volumes Status Filter: Click to show only virtual volumes with the selected status in the Virtual Volumes Detail table. |
|
• |
Virtual Volumes Detail table. For each virtual volume, displays its name, status, Operational State, Health State, Supporting Device, Latency, Data Rate, Ops Rate, and Capacity. |
|
• |
Alarm Summary. Displays alarms on virtual volumes. |