Chat now with support
Chat with Support

Foglight for Storage Management Shared 4.6 - User and Reference Guide

Getting Started Monitoring Storage Performance Investigating Storage Devices Investigating Storage Components Investigating VPLEX Storage Troubleshooting Storage Performance Managing Data Collection, Rules, and Alarms Understanding Metrics Online-Only Topics

Troubleshooting Database Limits

Foglight for Storage Management sets limits on the number of instances of each object type that can exist in the Database Repository. On the Administration tab, the Review Instances and Limits task enables you to view a table containing a list of Foglight for Storage Management object types.

For each object type, the table displays the instance limit, the number of instances currently in the database, the utilization (count/limit), and a status based on utilization. While the utilization remains below 90%, the object type status is Normal. When utilization reaches 90%, the status becomes Critical; if you intend to monitor new instances of this object type, you should take some steps to plan for the growth. At 100%, the status changes to Fatal and Foglight for Storage Management does not create anymore instances of the object type. For example, if the SanLUN object type is at 99% utilization, and you add an agent to monitor a new storage array that has 200 LUNs configured, the SanLUN instance limit will soon be reached and you will not see data for many of the new LUNs in the dashboards.

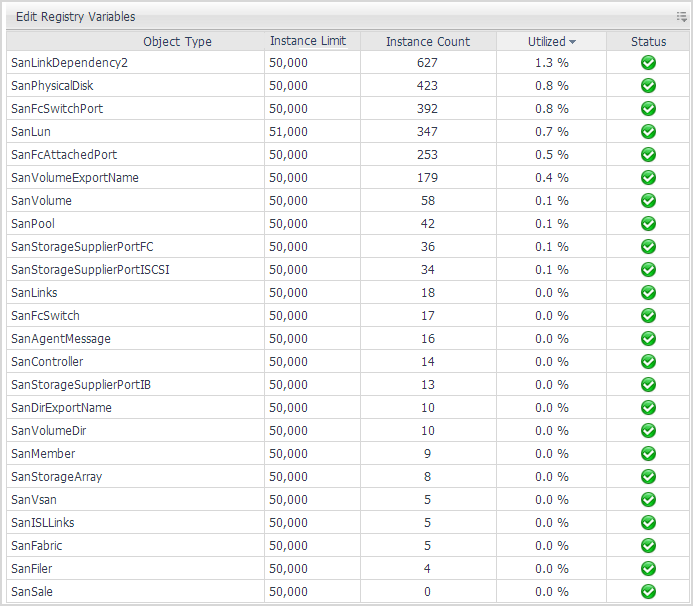
The limit on the number of instances per object type is a global default value, which is set in the registry variable called foglight.limit instances. You can override the limit for selected topology types.

1
On the Storage Environment dashboard, in the Administration tab, click Review Instances and Limits.
3
To increase or decrease a limit, click Edit Registry Variables and select foglight.limit.instances.

Understanding Metrics

This section defines the metrics displayed in the Storage & SAN dashboards. It also provides an overview of metrics in Foglight for Storage Management—you need this information if you intend to create new rules or custom dashboards.

This section contains the following topics:

Units of Measurement

Foglight for Storage Management uses the following units of measurement:

B/s — Number of bytes per second. Frequently converted to KB/s or MB/s.
ops/s — Number of operations per second.
ms — Milliseconds. Frequently converted to μs (microsecond).
m — milli — Thousandth.
ms/op — Milliseconds per operation.
MB — Capacity metrics are captured in MB (megabytes), but are frequently displayed in GB (gigabytes) or TB (terabytes).

Performance Metrics

In general, performance is gauged in terms of rates (such as data rates, ops to disk rates, frame rates), latency, and utilization. The selection of performance metrics displayed in any given dashboard depends on the selected device type and the metrics available from the device vendor.

The following tables define each metric and shows the topology name for the metric. You need the topology name when referencing the metric in user-defined rules and dashboards.

Performance metrics are organized into the following categories:

Related Documents

The document was helpful.

Select Rating

I easily found the information I needed.

Select Rating