|
2 |
Review overall performance in the Summary tab. |
|
• |
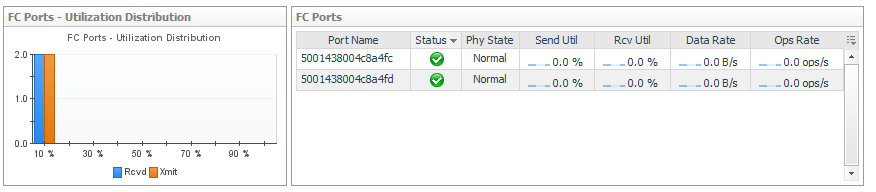
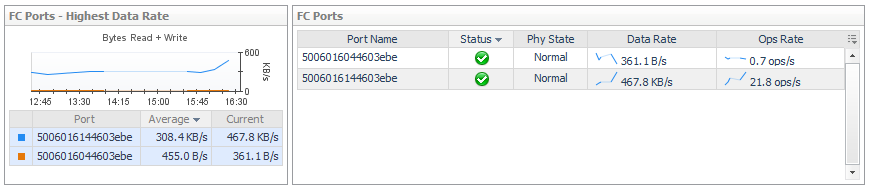
Details. Displays the port’s status, physical details, parent storage array or filer, port controller (for filers and non-cluster arrays) or member node (for cluster arrays), and current values for Data Rate, Ops Rate, Xmit Utilization, and Rcvd Utilization. |
|
• |
Charts. Displays the following metrics over the time period, if available: |
|
• |
Alarm Summary. Displays alarms on the port. |
|
3 |
If available, click the Topology tab. This tab is displayed for Fibre Channel (FC) ports only. |
|
• |
Basic Connectivity (diagram). Displays the selected port (left box) and its connection to its controller. If the port is an FC port, the N port on the fibre switch it connects to is also displayed. |
|
• |
Port Dependencies. On separate tabs, displays connections to LUNs (through the selected port) from virtual machines, ESX or Hyper-V servers, and physical hosts. If the selected port has problems or failures, the connected VMs or hosts may exhibit performance problems. |
|
2 |
Review overall performance in the Summary tab. |
|
• |
Controller Details. Displays the controller’s status, physical details, and parent device. |
|
• |
Charts. Displays the following metrics over the time period, if available: |
|
• |
Alarm Summary. Displays alarms on the controller. |
|
3 |
Review Port performance in the Port tab. |
|
• |
Port Details. List the ports, their status and physical state, and current values for Data Rate and Ops Rate. Click a |
|
2 |
Review overall performance in the Summary tab. |
|
• |
Details. Displays the directory’s status, physical details, and parent device. |
|
• |
Topology. Displays the connections from datastores to the selected directory. |
|
2 |
Review overall performance in the Summary tab. |
|
• |
Related Inventory. Displays a list of components from the perspective of the member (rather than the storage array). |
|
• |
Resource Utilization charts. Compares resources used by the member against resources used by the pool. |
|
• |
|
• |
Summary and Resource Information. Displays physical details about the member. |
|
• |
Alarm Summary. Displays alarms on the member. |
|
3 |
Click the Network tab. |
|
4 |
Click the Disks tab. |
