|
• |
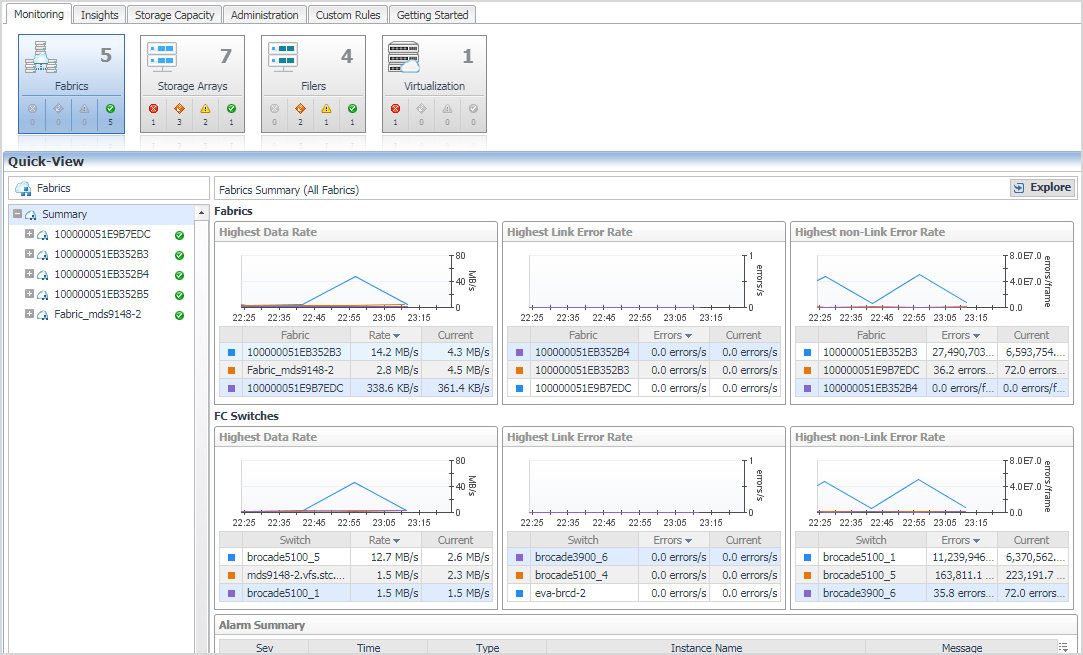
Monitoring Tab — Monitor your overall storage environment by device type. For more information, see Monitoring Your Storage Environment. |
|
• |
|
• |
|
• |
|
• |
|
• |
Storage Capacity tab — Monitor your storage capacity by device type. For more information, see Monitoring Storage Capacity. |
If your Foglight for Storage Management user account includes the Storage Administrator role, the Storage Environment dashboard also displays these tabs:
|
• |
Administration Tab — Manage configured agents, credentials, and modify data collection settings. |
|
• |
Getting Started Tab — Purchase a product license. |
|
• |
| |||
|
Contains four areas: Device List, Device Summary, FAQts, and Alarm Summary. | |||
|
Displays the list of storage devices that match the selected tile.
| |||
|
Displays performance and capacity metrics for the device selected in the Device List. | |||
|
Offers common searches in the form of questions. Scroll through questions, and click Show Me to see the answer to the currently displayed question. For more information, see Asking Questions About the Monitored Storage Environment. | |||
|
Displays a list of alarms for the device selected in the Device List. For more information, see Understanding Status, Alarms, and Rules in Foglight for Storage Management. |
When you begin monitoring your storage environment, a good way to start is by identifying poorly-performing devices and resolving the issues that are contributing to the problems. In Foglight for Storage Management, all storage devices and their child components are assigned a status, which enables you to see at glance which elements in your storage infrastructure need attention. Any device that enters a non-Normal status triggers an alarm. For more information, see Understanding Status, Alarms, and Rules in Foglight for Storage Management.
This section describes the following topics:
|
NOTE: When a component is selected, its detail views display the component’s Status followed by its State. Status is determined by Foglight for Storage Management as describe above. State refers to the physical state of a component as reported by the vendor; if the vendor does not provide the physical state, the state is unknown. A component’s physical state may affect its status only when an enabled rule triggers alarms based on state. Consult with your Foglight Administrator if you want to enable or create rules that perform this check. |
A storage device often has large numbers (thousands) of child components. With a few exceptions, alarms on child components do not change the status of the parent device. For example, a failed disk may have a Fatal status, but because arrays are designed to cope with a failed disk, the parent device continues to display a Normal status. The parent device status may be changed by child components in the following circumstances:
For information about changing default rules and alarm settings, see Managing Foglight for Storage Management Rules.
Use the Monitoring tab in the Storage Environment dashboard to gain a high-level understanding of the status of the devices in your environment, organized by device type. For a general description of the dashboard, see Introducing the Storage Environment Dashboard.
|
1 |
|
2 |
Click the Monitoring tab. |
|
• |
|
• |