|
3 |
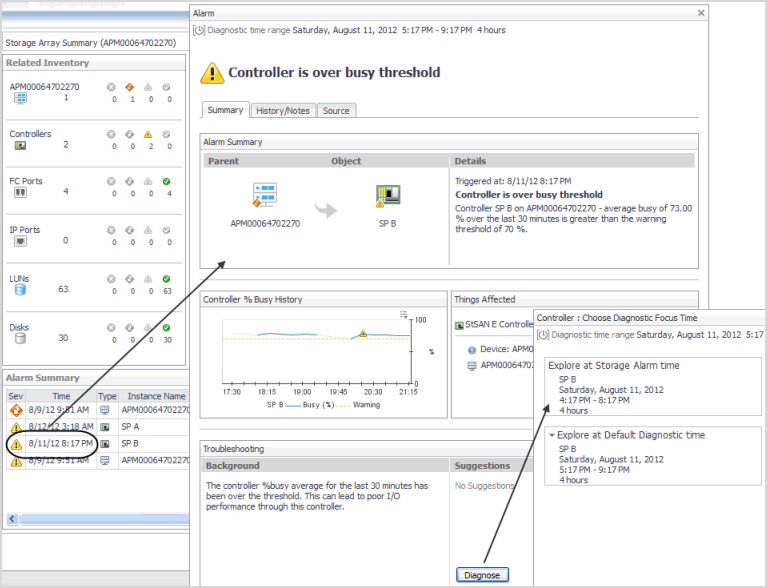
From the Troubleshooting pane, click the Diagnose button. |
|
• |
Explore at Storage Alarm time. Select this option when you want to view diagrams and other details of the affected component at the time the alarm occurred. Shows data for the time period leading up to and including the alarm time. For example, given an alarm time of 10:32 AM and the default four hour time range, the diagnostic time range is set to 6:32 AM – 10:32 AM. |
|
• |
Explore at Default Diagnostic time. Select this option when you want to determine if the situation causing the alarm persisted or if it resolved on its own. Shows data before and after the alarm, with the alarm time positioned three quarters of the way into the time range. For example, given an alarm time of 10:32 AM and the default four hour time range, the diagnostic time range is set to three hours before the alarm and one hour after the alarm, that is, 7:32 AM – 11:32 AM. If the current time falls within the range, for example, it is currently 11:05 AM, the time range is set to 7:32 AM – 11:05 AM. |
|
6 |
When you complete your investigation, in the breadcrumbs, click Storage Environment to return to the Choose Diagnostic Focus Time window. If desired, choose the other diagnostic time range. |
|
• |
Acknowledge. Continues to display the alarm, but it is marked as acknowledged until the alarm is triggered again. For example, for Warnings, an appropriate action may be to acknowledge the alarm and ignore it. |
|
• |
Acknowledge Until Normal. Continues to display the alarm, but it is marked as acknowledged until the affected component returns to the Normal status. This is useful when a component has failed and you want to know when it is replaced. |
|
• |
Clear. Deletes the alarm. Choose this option when the situation is resolved. |
|
TIP: When you close the window, the time range returns to the time range in use before your alarm analysis. If it does not, in the Time Range either click the Frozen Time Range |
This walkthrough introduces the quick views for fabrics and their components.
|
1 |
On the Storage Environment dashboard, ensure the Monitoring tab is selected. |
|
2 |
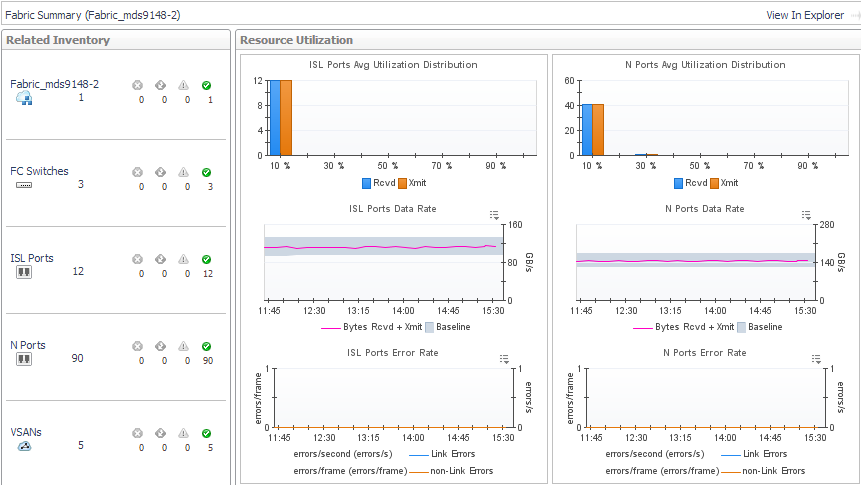
Click the Fabrics tile to open the Fabrics quick view. |
|
• |
|
• |
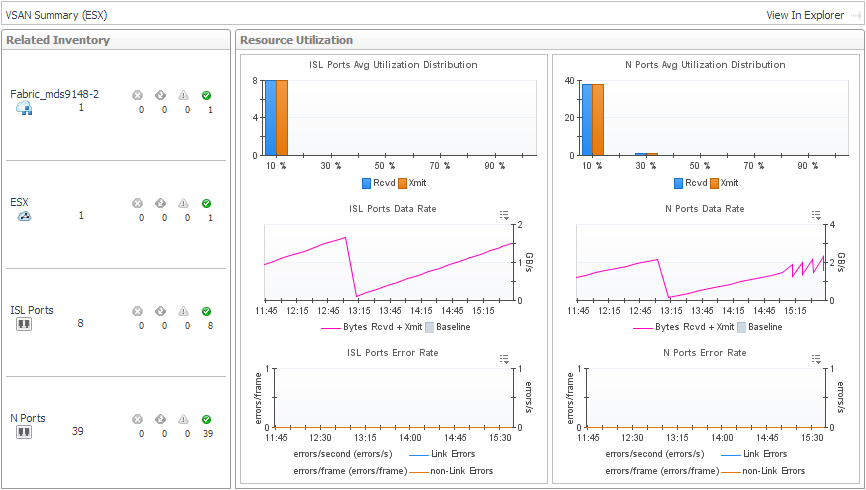
Avg Utilization Distribution. For each type of port, displays aggregated values for Rcvd Utilization and Xmit Utilization grouped by percentage of usage. Most of your port utilization should be in the lower percentages. When there are ports performing at high utilization rates, you may want to investigate port performance further. |
|
• |
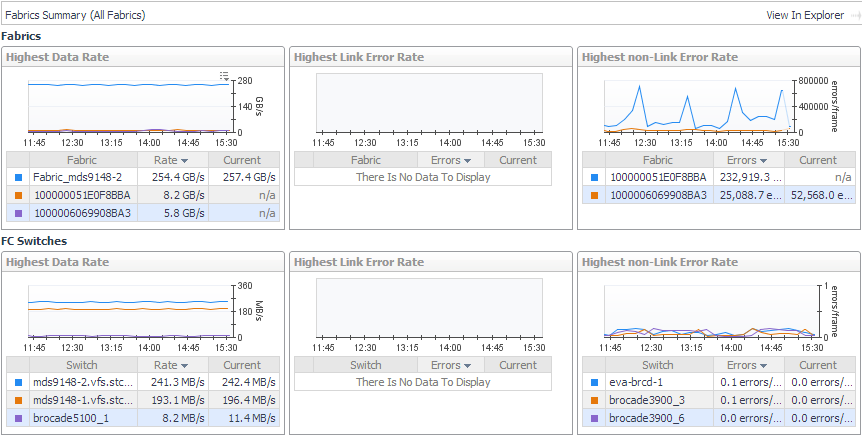
Data Rate. For each type of port, plots aggregated values for Data Receive Rate and Data Send Rate over the time period and displays the Baseline. |
|
• |
Error Rate. For each type of port, plots aggregated values for Link Error Rate and Non-Link Error Rate over the time period. |
|
• |
To explore details about the fabric, its switches, and its ports, click View in Explorer. See Exploring a Fabric. |
|
• |
To explore an FC switch in the selected fabric, in the Related Inventory view click FC Switches or an alarm icon, and select a switch. See Exploring a Switch. |
|
• |
To investigate a port used in the selected fabric, in the Related Inventory view click either ISL Ports or N Ports or an alarm icon, and select a port. See Investigating an FC Switch Port. |
|
• |
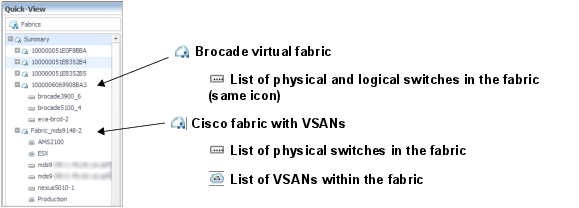
Cisco fabrics only —To investigate a VSAN used in the selected fabric, in the Related Inventory view click VSANs or an alarm icon, and select a VSAN. See Exploring a Cisco VSAN. |
|
• |
To return to the quick view, in the breadcrumbs, click Storage Environment. |
|
• |
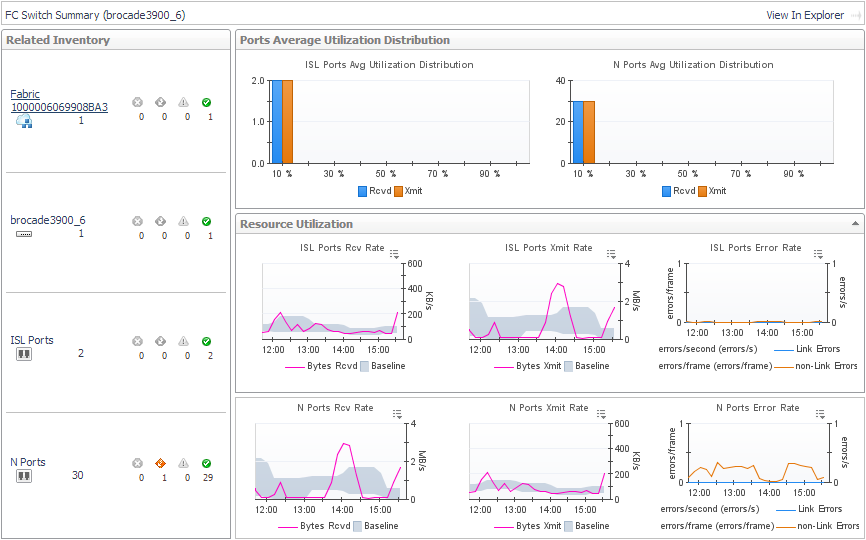
Ports Average Utilization Distribution. For each type of port, displays aggregated values for Rcvd Utilization and Xmit Utilization grouped by percentage of usage. Most of your port utilization should be in the lower percentages. When there are ports on the switch performing at high utilization rates, you may want to investigate port performance further. |
|
• |
Rcv Rate. For each type of port, plots aggregated values for Data Receive Rate over the time period and displays the Baseline. |
|
• |
Xmit Rate. For each type of port, plots aggregated values for Data Send Rate over the time period and displays the Baseline. |
|
• |
Error Rate. For each type of port, plots aggregated values for Link Error Rate and Non-Link Error Rate over the time period. |
|
• |
|
• |
To investigate a port used by the selected switch, in the Related Inventory view click ISL Ports or N Ports or an alarm icon, and then select a port. See Investigating an FC Switch Port. |
|
• |
To return to the quick view, in the breadcrumbs, click Storage Environment. |
|
• |
To explore details about the VSAN and its ports, click View in Explorer. See Exploring a Cisco VSAN. |
|
• |
To investigate a port used by the selected VSAN, in the Related Inventory view click ISL Ports or N Ports or an alarm icon, and then select a port. See Investigating an FC Switch Port. |
|
• |
To return to the quick view, in the breadcrumbs, click Storage Environment. |
|
1 |
On the Storage Environment dashboard, ensure the Monitoring tab is selected. |
|
2 |
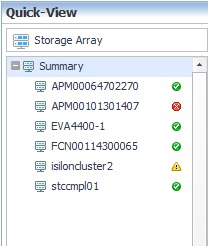
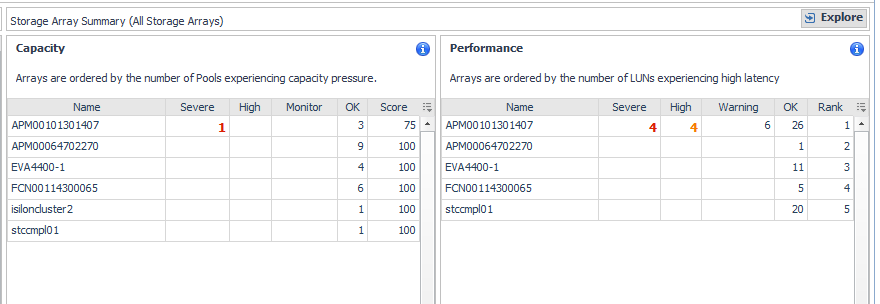
Click the Storage Arrays tile to open the Storage Arrays quick view. |
|
3 |
|
• |
|
• |
|
• |
|
• |
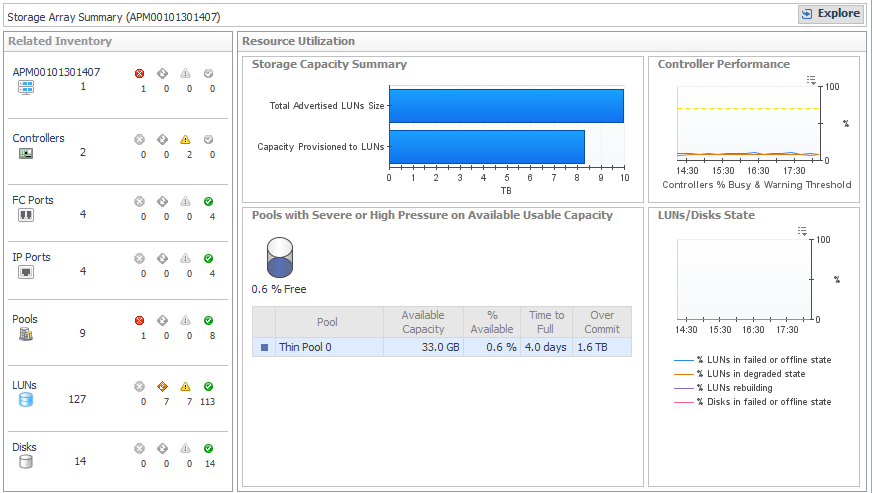
Related Inventory. Contains alarm summaries for the selected storage array and its controllers, FC ports, IP ports, pools, LUNs, and disks. |
|
• |
Storage Capacity Summary. Displays current values for Total Advertised LUNs Size and Capacity Provisioned to LUNs. |
|
• |
Controller Performance. Plots % Busy values by controller over the time period and displays threshold lines (defined in registry variable StSAN.Controller.PctBusyThreshold). |
|
• |
Pools with Severe or High Pressure on Available Usable Capacity (or Raw Capacity) |
|
• |
LUNs/Disks States. Plots the percentage of disks and LUNs in the storage array in problem states. Problem states are reported by the vendor. Resolving these issues may improve LUN performance. |
|
• |
|
• |
To return to this quick view, in the breadcrumbs, click Storage Environment. |
|
1 |
On the Storage Environment dashboard, ensure the Monitoring tab is selected. |
|
2 |
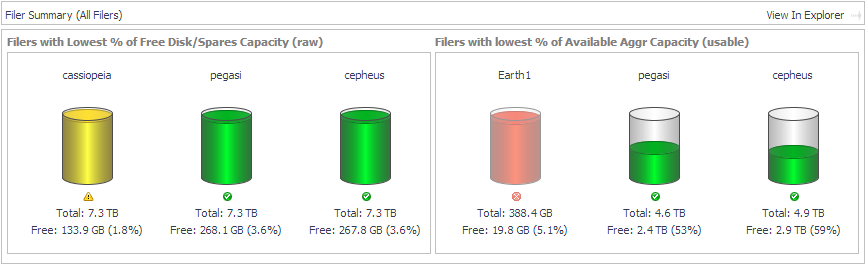
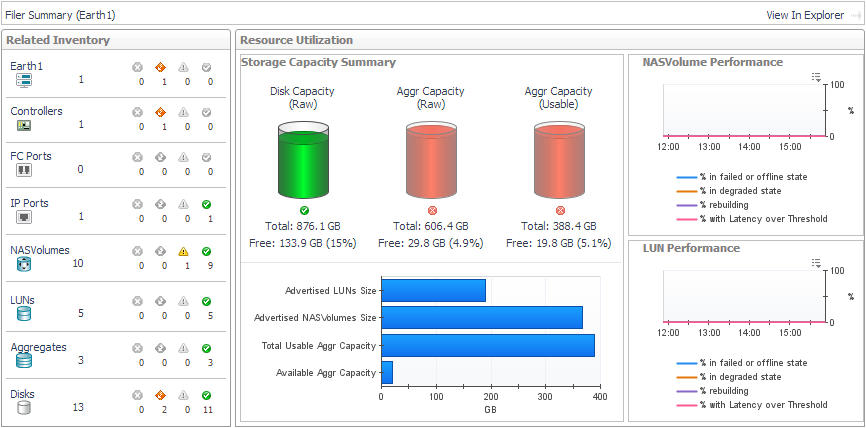
Click the Filers tile to open the Filers quick view. |
|
• |
Filers with Lowest % of Free Disk/Spares Capacity (raw). Displays cylinders showing the amount of used Free Disk/Spares Capacity (Raw). Below each cylinder, you can see total and free capacity. |
|
• |
Filers with Lowest % of Available Aggr Capacity (usable). Displays cylinders showing the amount of used Aggr Capacity (Usable) Free. Below each cylinder, you can see total and free capacity. |
|
• |
|
• |
Aggregate capacity: StSAN.FilerAggregates.PctUnallocatedCapacityThreshold.[Fatal|Critical|Warning] |
|
• |
Storage Capacity Summary. The cylinders show the amount of capacity consumed in the filer, expressed using current values for the following pairs of metrics: |
|
• |
NASVolume Performance. Plots the percentage of NASVolumes in the filer in problem states. Problem states are reported by the vendor. Resolving issues may improve volume performance. |
|
• |
LUN Performance. Plots the percentage of LUNs in the filer in problem states. Problem states are reported by the vendor. Resolving issues may improve LUN performance. |
|
• |
To explore details about the filer and its child components, click View in Explorer. See Exploring a Filer. |
|
• |
To return to this quick view, in the breadcrumbs, click Storage Environment. |