Chat now with support
Chat with Support

Foglight for Storage Management Shared 4.6 - User and Reference Guide

Getting Started Monitoring Storage Performance Investigating Storage Devices Investigating Storage Components Investigating VPLEX Storage Troubleshooting Storage Performance Managing Data Collection, Rules, and Alarms Understanding Metrics Online-Only Topics

Storage Capacity tab

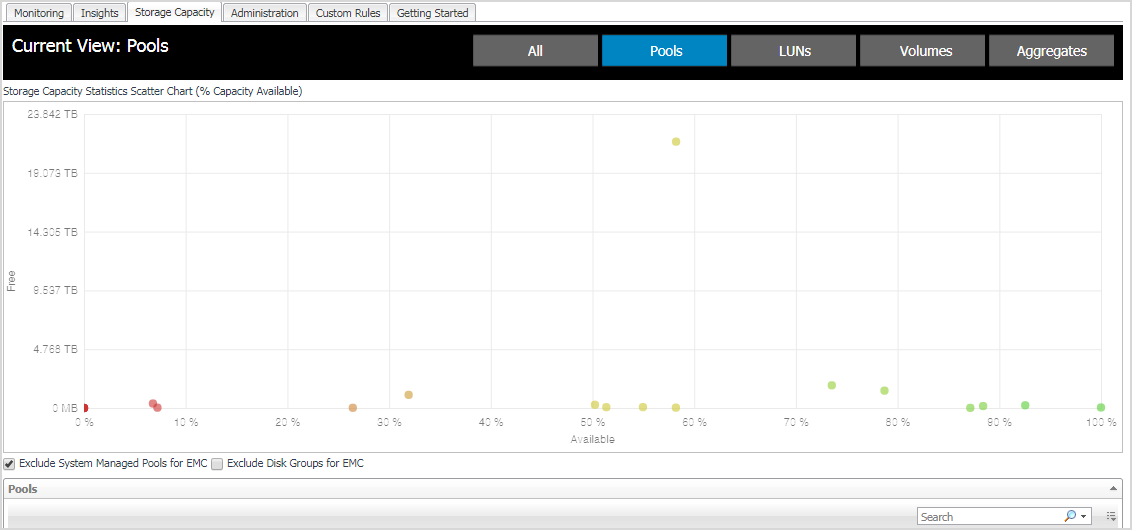
The Storage Capacity tab includes charts and tables for monitoring the capacity being used by the all devices, pools, LUNs, NASVolumes, or aggregates. Select what you want to monitor by clicking one of the following button at the top of the view: All, Pools, LUNs, Volumes, or Aggregates.

The middle part of the view includes the Storage Capacity chart, which shows the pools with the scatter chart that uses Free as Y axis and Capacity Available Percent as X axis.

The lower part of the view includes the Storage Capacity table, which displays the following information for the selected option (All, Pools, LUNs, Volumes, or Aggregates).

Name

Device name.

Click the name to open the device Summary tab.

Type

Device type.

Array/Filer

Array or filer name.

Time to Full

Time remaining until the maximum capacity is reached.

Health Score

Health score. For details about how health scores are calculated, see Pool and Volumes health scores.

Capacity Used (% Available)

Capacity currently used.

Free

Capacity currently available (free).

Total

Total device capacity.

Health scores are base on two criteria:

The code is in a derived metric, so that the heath scores are recalculated on the fly, whenever new data for a pool is submitted. The code works as follows:

Starting score: 75%

If long term (preferred) or short term predictive data is available, the starting score is reset:

< 14 days to full: set to 10%

< 28 days to full: set to 35%

< 84 days to full: set to 50%

> 300 days to full: set to 100%

> 200 days to full: set to 85%

> 100 days to full: set to 70%

From the starting score, the code adjusts the calculations based on the percent of free space available:

< 10%: score adjusted -30%

< 20%: score adjusted -20%

< 30%: score adjusted -10%

> 90%: score adjusted +30%

> 80%: score adjusted +20%

> 70%: score adjusted +10%

Any computed values over 100 are changed to 100%.

Any computed values < 0 are changed to 0%.

Trending data for volumes is not available yet. Therefore, the health score is currently based solely on the currently available capacity.

The code works as follows:

Starting score: 75%

From the starting score, the code adjusts the calculations based on the percent of free space available:

< 10%: score adjusted -30%

< 20%: score adjusted -20%

< 30%: score adjusted -10%

> 90%: score adjusted +30%

> 80%: score adjusted +20%

> 70%: score adjusted +10%

Any computed values over 100 are changed to 100%.

Any computed values < 0 are changed to 0%.

Creating Storage Reports

In the Storage Environment dashboard, you can create reports to share with colleagues. You can also copy and edit existing reports. If the Reports tab is not displayed, your Foglight for Storage Management Administrator may need to modify your user account to include the General Access role.

1
On the Storage Environment dashboard, click the Insights tab, and then click Reports.
The Create a Report wizard opens. Use the Next and Back buttons to navigate between pages.
2
Click Finish to generate the report.


Investigating Storage Devices

To find out more about the performance of a storage device and its components, you use the Storage Explorer dashboards.

This section covers the following topics:

Introducing the Storage Explorer

The Storage Explorer enables you to quickly find and examine any storage device in your storage environment. The Storage Explorer has a Topology tree—displayed in the navigation panel below the list of Dashboards—that contains branches for Fabrics, Filers, and Storage Arrays. The fabrics in the Fabrics branch can be expanded to show FC switches and VSANs. When you select a device from the tree, the Storage Explorer opens a dashboard displaying details about that device.

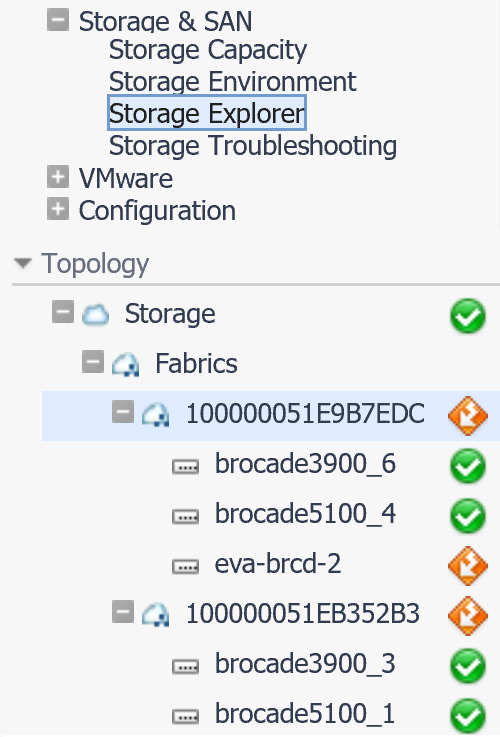
This walkthrough describes how to open the Storage Explorer and select a storage device. If you select a top-level device type node, such as Fabrics, the Storage Environment quick view is displayed. For more information about the quick view, see Monitoring Your Storage Environment.

1
On the navigation panel, under Dashboards, click Storage & SAN > Storage Explorer.

Displays and controls the period of time represented in the dashboard. The default is the last four hours. For more information, see “Time Range” in the online help.

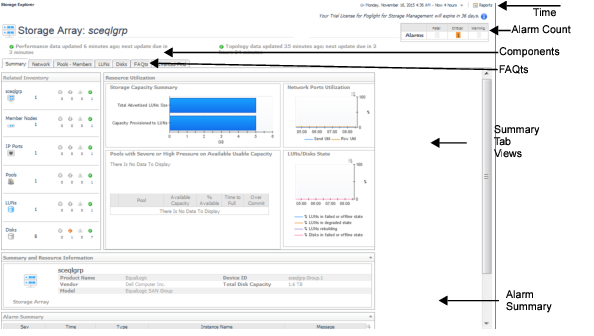
Displays counts of all the alarms at each severity level that are still active (not cleared) at the end of the displayed time range. Unlike the Alarm Summary view, the Alarm Count includes alarms for the device and all its child components. Click an alarm count to display the alarms at that severity level.

When the Summary tab is selected:

The Alarm Summary displays device-level alarms (if any).

Contains a tab for each type of component used by the selected device, such as ports, drives, and disks.

When a component tab is selected:

The Alarm Summary displays component-level alarms (if any).

Contains questions appropriate for the selected device type. For information on how to use a FAQts tab, see Asking Questions About the Monitored Storage Environment.

Displays alarms for the selected device (on the Summary tab) or the type of component (on the Component tabs).

Related Documents

The document was helpful.

Select Rating

I easily found the information I needed.

Select Rating