|
1 |
In the navigation panel, under Dashboards, click APM > Search > Hits. |
|
2 |
Click Simple Search. |
|
TIP: An APM Administrator can increase or decrease the maximum time range displayed in the list through the Configure Advanced Options > Settings dashboard. See the Search Time Range Limit option under the Archiver Query Settings. | |
|
Optional—search hits based on the URI path. Specify a full or partial path using asterisks (*) as wildcards as required. For example, /css* returns all hits that have the subdirectory css in the Request Path hit detail. | |
|
4 |
Click Search. |
|
1 |
In the navigation panel, under Dashboards, click APM > Search > Hits. |
|
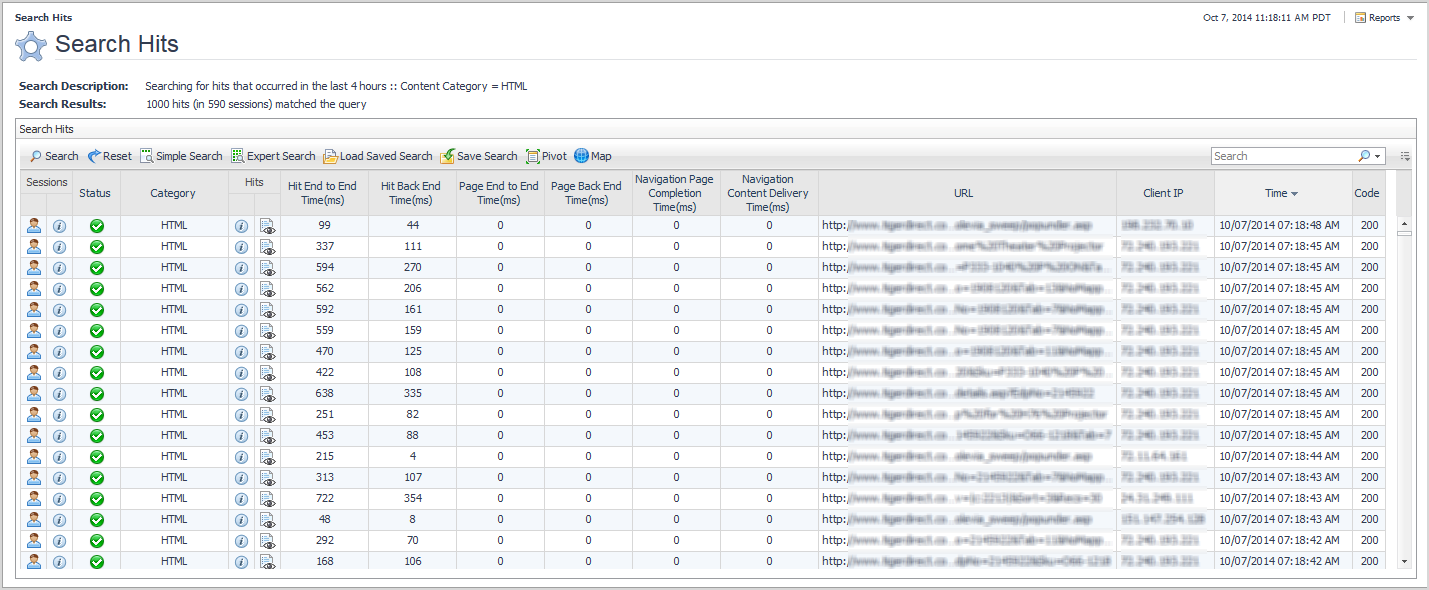
2 |
Click Expert Search. |
|
TIP: An APM Administrator can increase or decrease the maximum time range displayed in the list through the Configure Advanced Options > Settings dashboard. See the Search Time Range Limit option under the Archiver Query Settings. | |
|
If you selected Time Range=specified time range, click the Calendar | |
|
If you selected Time Range=specified time range, select a length of time to search (starting from the starting time). | |
|
Optional—search hits based on the URI path. Specify a full or partial path using asterisks (*) as wildcards as required. For example, /css* returns all hits that have the subdirectory css in the Request Path hit detail. | |
|
Optional—specify one or more conditions to match. Click Add. You can define a match condition on any hit detail or metric listed in the Source list. For help creating match conditions, see Defining match conditions for expert searches. |
|
4 |
Click Search. |
|
TIP: By default, a hit search returns a maximum of 1,000 hits. An APM Administrator can change this limit using the Hit Search Result Limit setting in the Configure Advanced Options > Settings dashboard. The APM Administrator can increase or decrease this limit within the range of 1 to 1,000 hits, but can never increase it over 1,000 hits. |
|
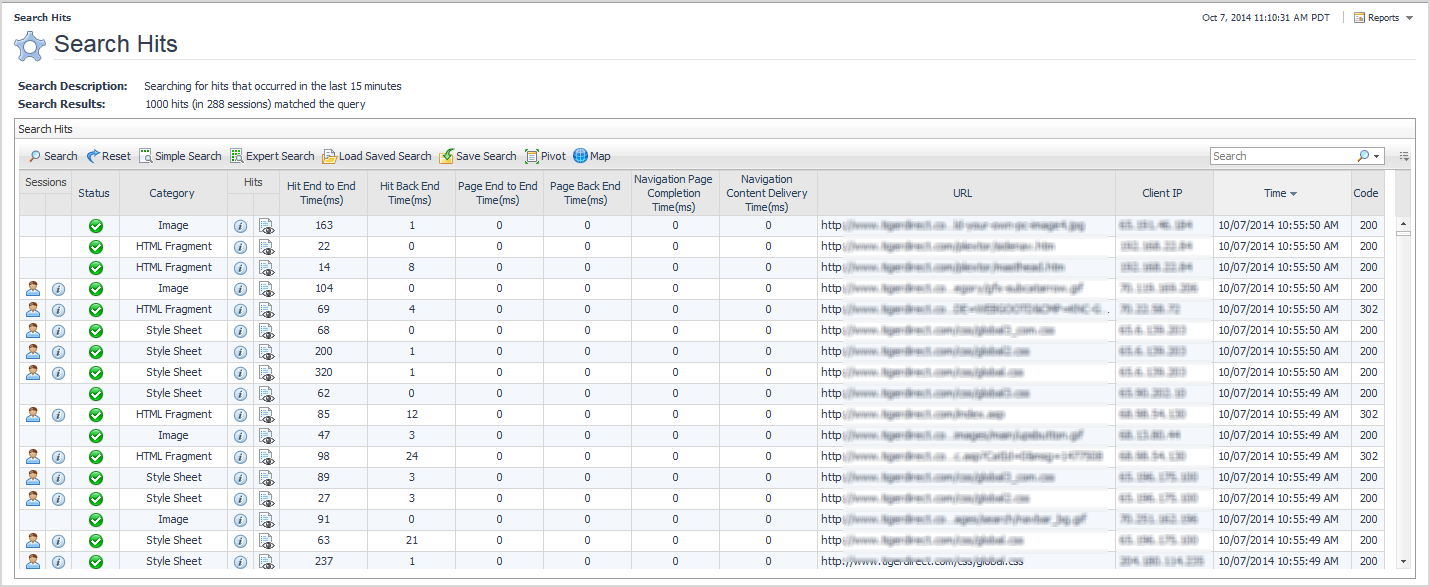
When a hit belongs to a session, the Session Explorer | |||||||||
| |||||||||
|
NOTE: For a custom field to appear in search results, the custom field’s Storage option must be set to Show in search results or First column in search results. See “Defining custom fields” in the online help. | |||||||||
|
• |
Status—look for icons other than the Normal icon. A hit can be set to a non-normal status due to a client or browser error code or when the hit matched some set of conditions defined within a hit analyzer. APM Administrators define and manage hit analyzers. |
|
• |
Code—look for client error codes (400+) or server error codes (500+). Remember though that Web 2.0 applications may not return error codes, because they redirect users to a helpful error page rather than a generic error page. In this case, you need to rely on analyzers catching the errors and setting the hit status to non-normal. |
|
• |
End-to-End Time—very high end-to-end times may indicate a problem with the amount of content on a page or a very slow web server. |
|
• |
Back End Time—very high back end times may indicate a problem with the web server. |
|
• |
Exception—any exceptions should be reported to the application developer. |
|
3 |

|
4 |
To drill down to the hit details, click Hit Detail View |
|
6 |
To map your results geographically, return to the search results. Click Map |
