|
|
• |
|
|
|
|
|
|
|
|
|
|
|
|
|
|
|
|
|
|
|
|
|
|
|
|
|
|
|
|
|

|
1 |
On the navigation panel, under Dashboards, click APM > Transactions. |
|
2 |
Click the down arrow in the Show transactions in box and select the transaction group you want to view from the list. |
|
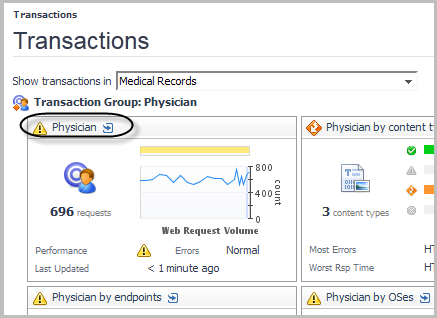
3 |
Locate a transaction group that is experiencing errors. For example, users in the Physician transaction group are experiencing poor performance. The health status icon indicates Warning status |
|
4 |
|
TIP: The detail view, and the tabs available, depend on the type of transaction selected. For example, drilling down on a Real User (APM) tile opens a performance detail view (as shown), while drilling down on a pivot result opens a summary view with tiles for each type of pivot you have defined (see Pivot Breakdown detail view for details). |
|
5 |
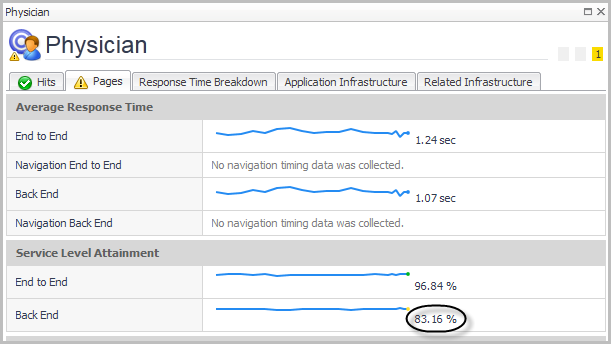
Click the Pages tab. Here you can see that the Warning status has been triggered by the Service Level Attainment for Back End dropping below an acceptable threshold. |
|
6 |
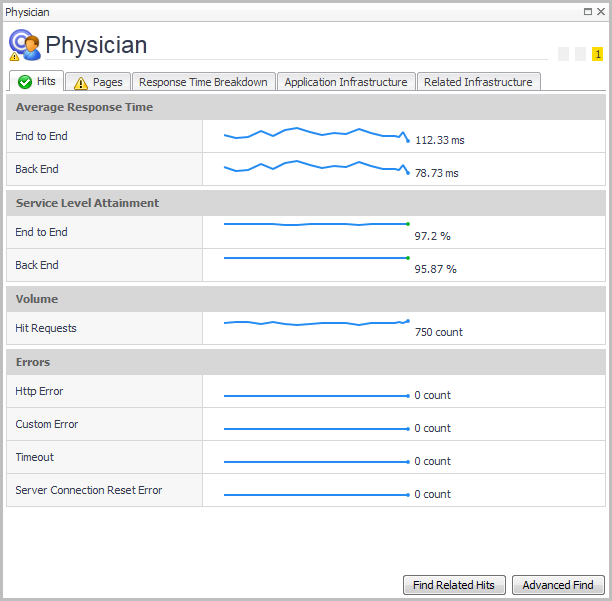
Click Find Related Hits to investigate further. |
|
1 |
On the navigation panel, under Dashboards, click APM > Transactions. |
|
2 |
Click the down arrow in the Show transactions in box and select the transaction group you want to view from the list. |

|
4 |
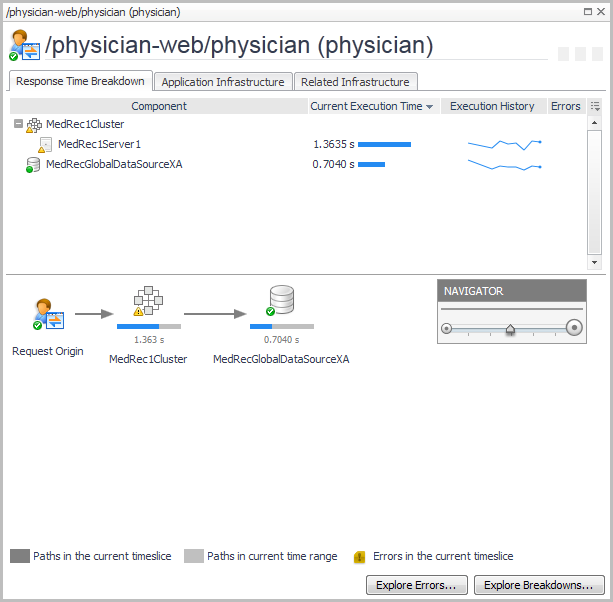
Click the name of the transaction (/physician-web/physician (phys...)) in the title bar of the tile to drill down for more information. |
|
• |
The dark grey arrows (Paths in the current timeslice) indicate the path taken by at least one request in the current timeslice (that is, the most recent sample period reported by the agent). |
|
• |
The light grey arrows (Paths in current time range) indicate the path taken by at least one request in the time range selected with the zonar (for example, the last four hours). |
|
• |
Click Explore Breakdowns to open the Response Time Breakdown Explorer. |
|
• |
Click Explore Errors to open the Error Breakdown Explorer. |
|
• |
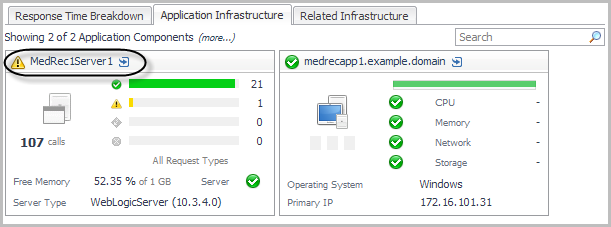
Click the Application Infrastructure tab to investigate the application components. This tab displays a tile for each component. In this example, there is a host (medrecapp1.example.domain) and an application server (MedRec1Server1). |