|
• |
On the navigation panel, under Dashboards, click APM > Web Sites and Endpoints. |
|
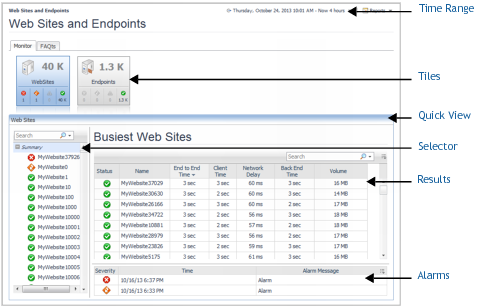
When the Web Site tile is selected, the selector lists sites and applications by name. When the Endpoints tile is selected, it lists endpoints as a combination of IP address and port number. The selector sets the Results view as follows:
| |||
|
1 |
In the navigation panel, under Dashboards, click APM > Web Sites and Endpoints. |
|
4 |
Sort the table by Volume to see the busiest sites|endpoints in terms of the total size of all HTTP messages sent and received. |
|
5 |
Sort the table by End-to-End Time to see which of the busiest sites|endpoints also contributed to the longest average hit download times. Scan the values for the other timing metrics to determine where time is being spent: on the client side, traversing the network, or on the server side. |
|
1 |
In the navigation panel, under Dashboards, click APM > Web Sites and Endpoints. |
