|
1 |
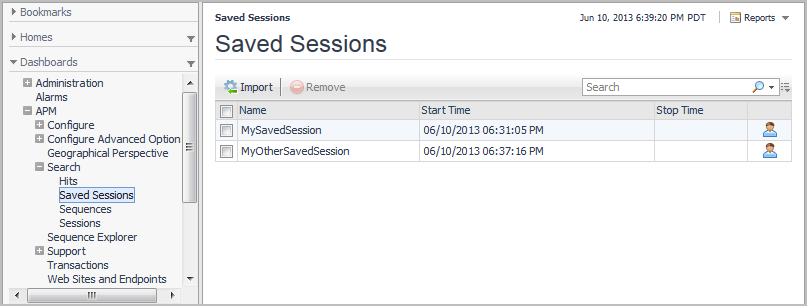
In the navigation panel, under Dashboards, click APM > Search > Saved Sessions. |
|
2 |
|
TIP: If maps do not display in your browser—for example, if you are using Microsoft® Internet Explorer® version 8 or earlier—try using a different browser. For a list of supported browsers, see the Foglight System Requirements and Platform Support Guide. |
|
2 |


|
5 |
If you want to see all search results in this dashboard, click Remove Filtering. You can return to the subset of results by clicking Restore Filtering. |
|
7 |
If you want to save a map for use in a custom dashboard, click Publish. For more information, see Publishing maps and charts to custom dashboards. |
|
2 |

|
5 |
|
7 |
If you want to see all search results in this dashboard, click Remove Filtering. You can return to the subset of results by clicking Restore Filtering. |
|
9 |
If you want to save a chart for use in a custom dashboard, click Publish. For more information, see Publishing maps and charts to custom dashboards. |
