지금 지원 담당자와 채팅
지원 담당자와 채팅

Foglight APM for Real User Experience 5.9.9 - User Guide

Getting started with Foglight APM Monitoring transactions Viewing real user activity from a geographical perspective Assessing real user experiences during key sequences Monitoring the performance of web sites and endpoints Searching APM data Replaying sessions, hits, and sequences Visualizing search results Creating custom drag-and-drop dashboards APM tile and view reference

Host tile

NOTE: For hosts, always select the host object, regardless of whether or not the host is virtual (for example, Hyper-V® or VMware®). Foglight looks for the appropriate host extensions and displays the associated host dashboard (physical or virtual).
Alarms. A count of fatal, critical, and warning alarms on the host system.
CPU. An icon representing the health state of the CPU, and the CPU utilization expressed as a percentage of the total available.
Memory. An icon representing the health state of the memory, and the memory utilization expressed as a percentage of the total available.
Network. An icon representing the health state of the network transactions, and the network utilization expressed as a percentage of the total available.
Storage. An icon representing the health state of the storage (disk space), and the disk utilization expressed as a percentage of the total available.
Operating System. The name of the operating system.
Primary IP. The primary IP address for the host system.

JMX tile

MBeans. The current average number of MBeans.
MBean Health Breakdown. The current number of MBeans in each state (Normal , Warning , Critical , Fatal ), along with a color-coded bar. The length of colored bar indicates the number of MBeans in the corresponding state compared to the total number of MBeans.
Free Memory. The current free JVM memory, expressed as a percentage of the total allocated.
CPU Usage. The current average CPU usage.
Threads. The current number of threads.
GC. The period average garbage collection overhead expressed as a percentage for the selected time range.

MQ tile

Topology Object Name: MQQueueManager
Number of Connections. The average number of queue manager connections.
Health History Bar. The color-coded bar represents the alarm state of the monitored component over the time range selected in the SOC. The color of the bar changes depending on the alarm state. Red indicates a Fatal state, orange indicates Critical, yellow means Warning, and green is the Normal state.
Enqueue/Dequeue. The plotted message enqueue and dequeue rates.
Status. The average queue status for the time range: available, unavailable, or unknown.
Dead Letter Queue Depth. The average depth of the dead letter (undeliverable messages) queue.

Oracle tile

Use the Oracle Tile to gather performance information about the state of Oracle® database transactions monitored by Foglight for Oracle. This tile displays the current top used resources from the list below.
Sessions. The current average number of active sessions.
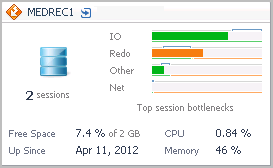
Top Session Bottlenecks. A breakdown of the health state of potential session bottleneck points by severity. The four top used resources from the list below are displayed on the tile.
Free Space. The amount of database storage space available, expressed as a percentage of the total available.
Up Since. The date the database was last restarted.
CPU. The average CPU usage for all Oracle® agents.
Memory. The average memory usage for all Oracle agents.
관련 문서

The document was helpful.

평가 결과 선택

I easily found the information I needed.

평가 결과 선택