|
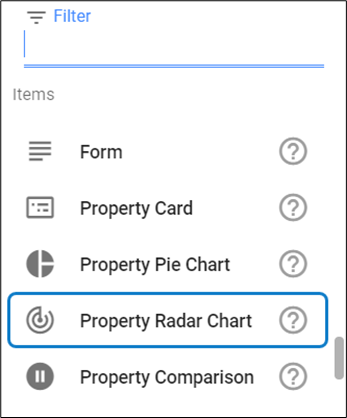
Property Radar Chart
Property Radar Chart is useful for comparing multiple numeric attributes.
To create a Property Radar Chart View:
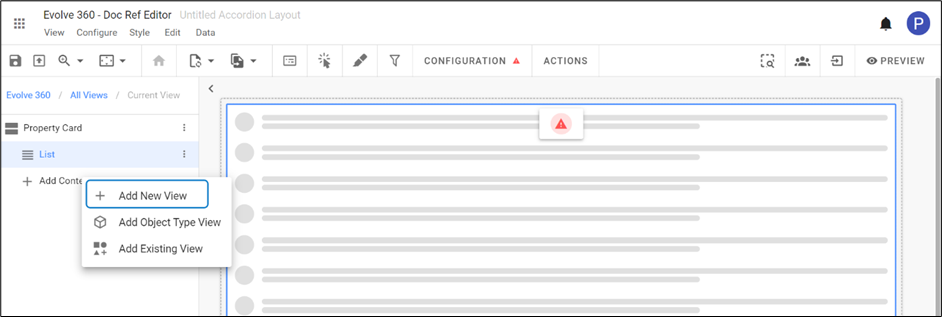
1. Click on All Views in the editor and then click on  icon placed at the bottom of the list of views. icon placed at the bottom of the list of views.
2. As the Property Radar Chart works like an Object Type View which returns the context from a single source.
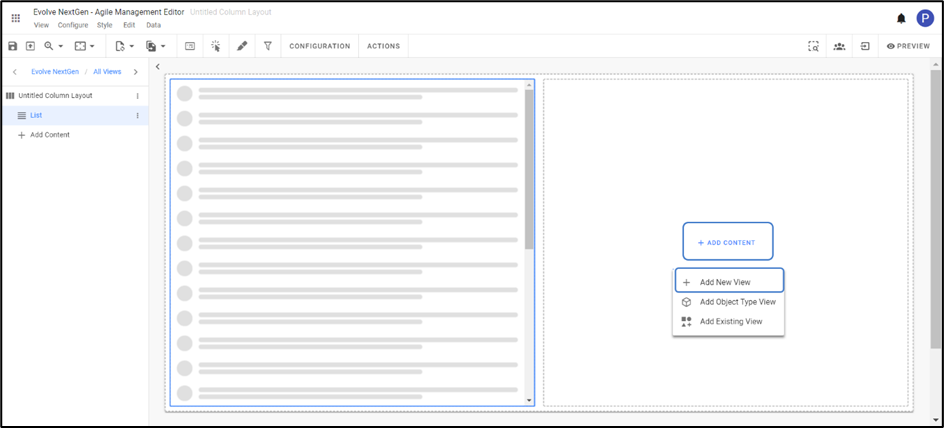
For an instance, a Column layout is chosen, and configure a List View in the first column.
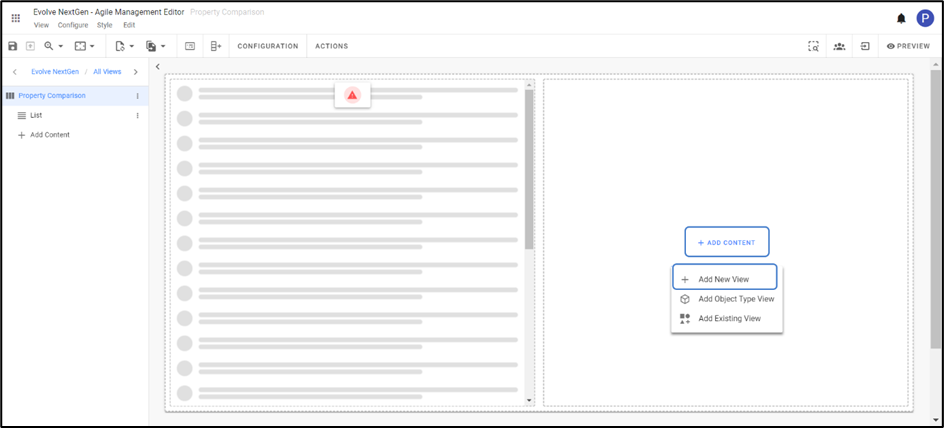
3. To add Property Radar Chart in the second column,
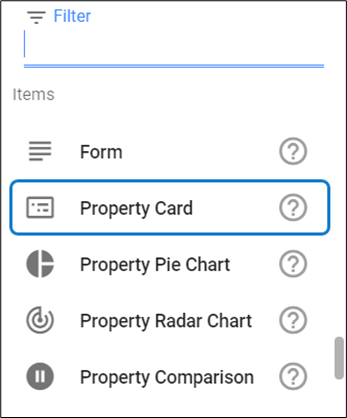
Click Add Content > Add New View > Select Property Radar Chart.
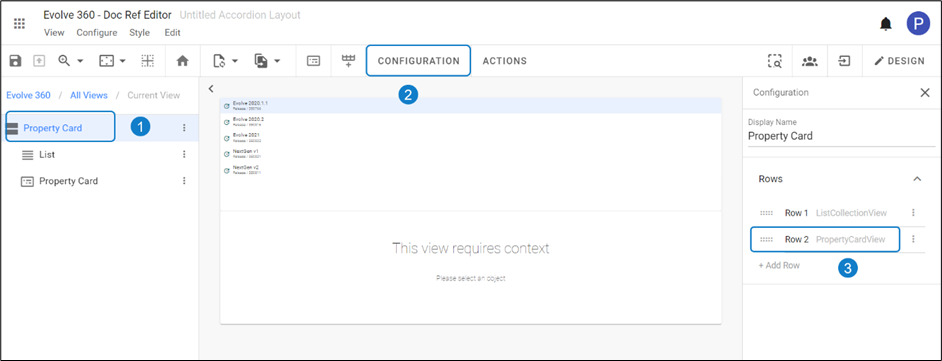
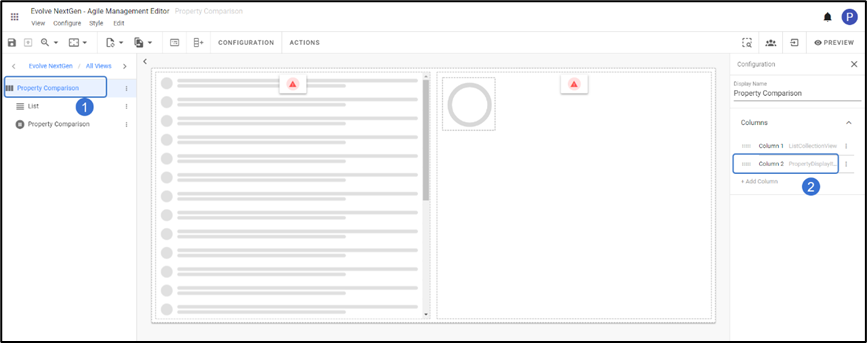
4. To pass the context from the source,
Click on the title of the layout and then Configuration from the toolbar.
Click Column 2.
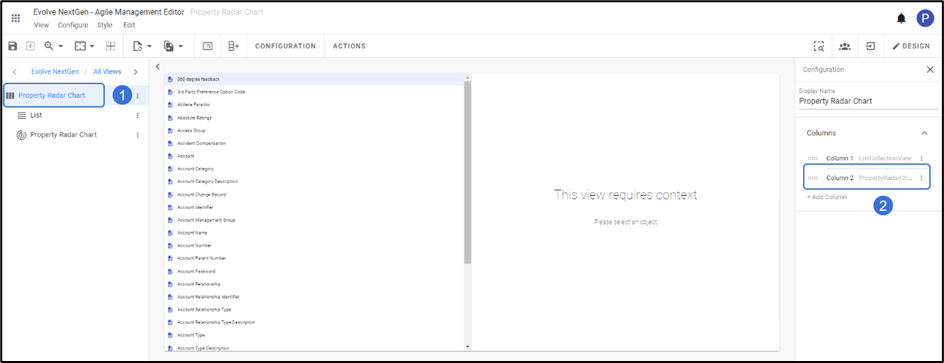
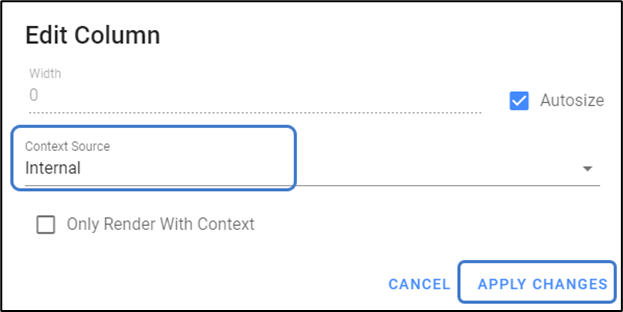
Click Context Source > Select Internal > Apply Changes.

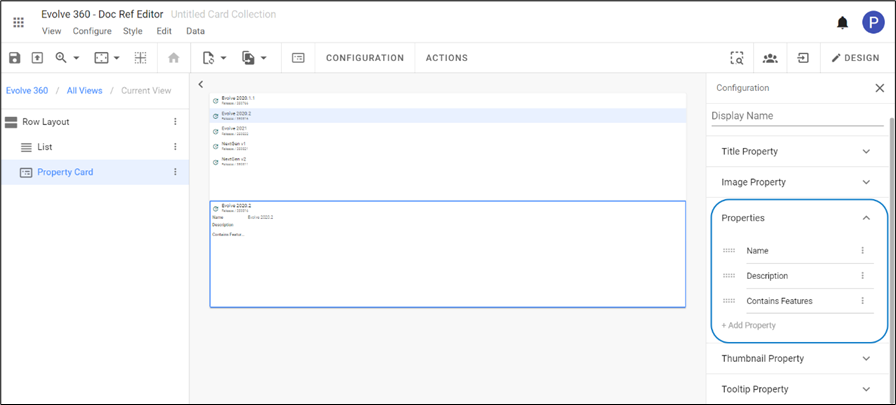
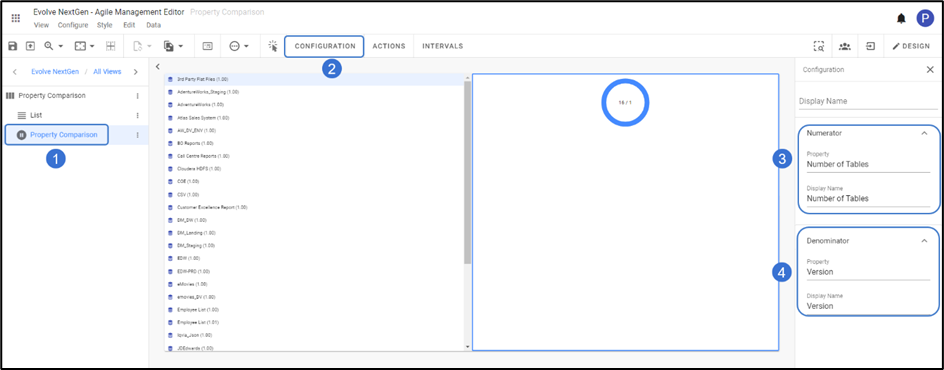
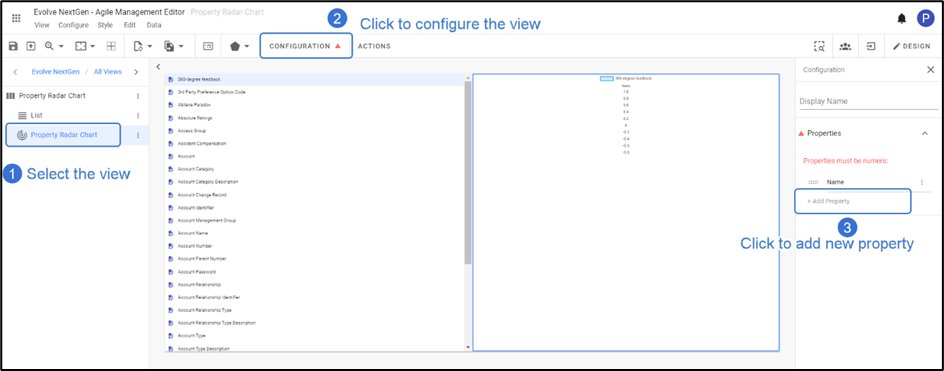
5. Attributes need to be added to complete the view.
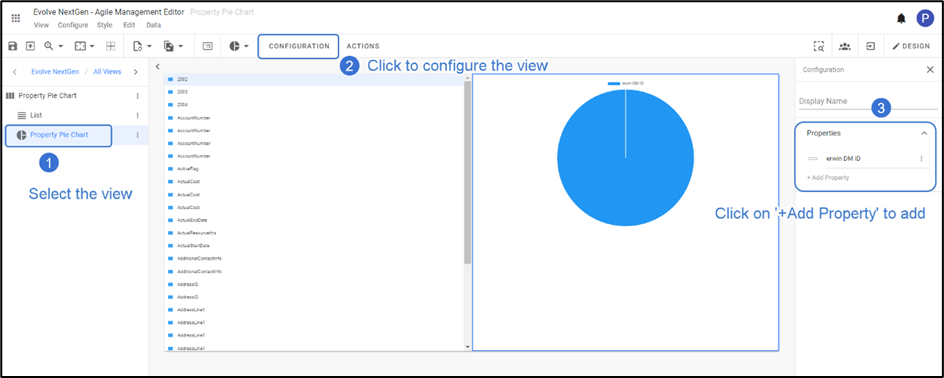
To configure the Property radar Chart, click on Configuration from the toolbar or right-click on the view.
By default, the property is set with Name. Edit the property or click Add Property for the new one.
Note: Properties added must be numeric.
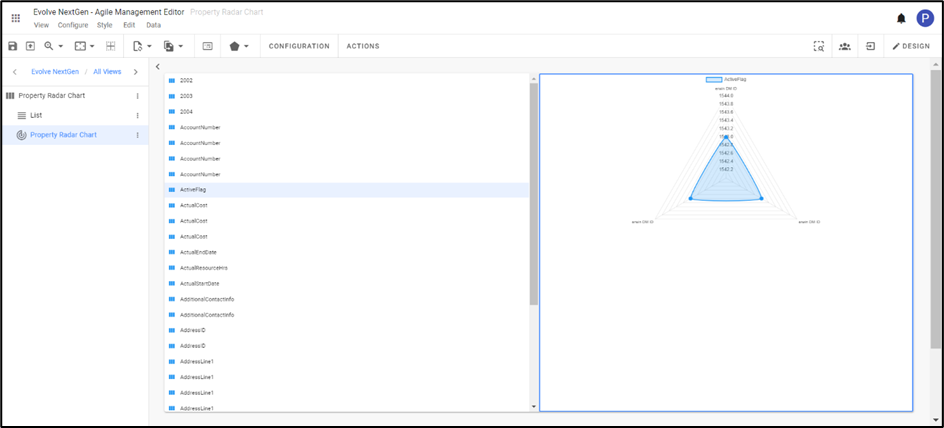
6. The Preview of the Property Radar Chart with three defined properties.
|