When a job is in Waiting for Media state, it implies that the job is unable to initiate data transfer as the target drive or media item is unavailable. The Diagnose Job method allows you to determine the exact reason for this state.
A job may be in the Waiting for Media state due to the following reasons:
|
1 |
In the Navigation pane, click Job Status. |
|
2 |
In the list of jobs, select the job, and click Diagnose Job. |
|
3 |
On the Diagnose Media Request page, you can view the following information: |
|
• |
Media Request ID: Media request ID. |
|
• |
Request Type: Backup or restore. |
|
• |
Status: Status of the media request. |
|
• |
Priority: Media request priority. |
|
• |
Client: NetVault Client on which the job is running. |
|
• |
Media: Target media and group label (if specified). |
|
• |
Reuse Media: The “Reuse Media” option is selected or not. |
|
• |
Required Space: Amount of space required on the media to complete the current request. |
|
• |
Ensure backup is the first on the target media: The “Ensure This Backup is First on the Media” option is selected or not. |
|
• |
Auto-Label: The “Label Blank Media Automatically” option is selected or not. |
|
• |
Mark Read-Only After: The “Mark Media Read-Only” option is selected or not. |
|
• |
Media Format: Media format. |
|
• |
Unload on Completion: Media to be unloaded after job completion or not. |
|
• |
Drives: Drive on which the tape resides. |
|
• |
Force Local: The “Local Drives Only” option is selected or not. |
|
• |
Network Compression: The “Network Compression” option is selected or not. |
|
a |
In the Navigation pane, click Job Status. |
|
b |
|
a |
|
c |
|
1 |
In the Navigation pane, click Job Status. |
|
2 |
|
• |
If you selected a restore job, click Edit Job and make your changes on the Edit Restore Job page. |
|
• |
Job Details: This area shows the following information: job name, job ID, job type (backup or restore), and name of the client. |
|
• |
Configuration: This area lets you create, edit, and view the protection sets. It shows the selections, the plug-in options, schedule, source storage, target storage, and advanced options. To make changes to any of these details, click the corresponding edit icon. |
|
• |
Recent Instances: This table lists the recent instances of the job. It shows the following information: Run time, duration, job size, instance ID, phase ID, and status (Succeeded, Failed, Aborted, and others). |
|
3 |
To save your changes or submit the job for scheduling, click Save or click Save & Submit, respectively. |
|
• |
Save changes creating a new job using the supplied name: Select this option to save the changes to a new job. |
|
• |
Save changes renaming this job to the supplied name: Select this option to rename the existing job. |
|
5 |
Click OK. |
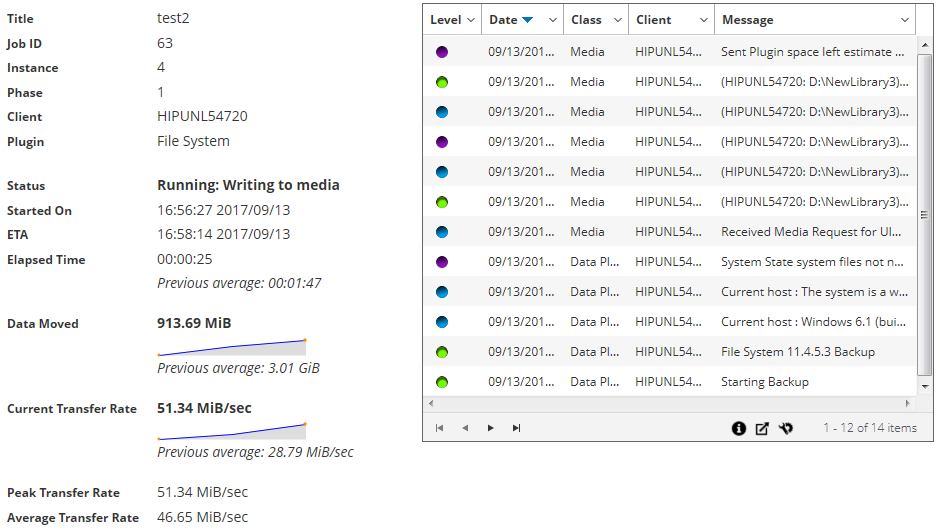
You can monitor the progress of a job from the Monitor Job page. The page displays the job status, data transfer rate, log messages, and other job details.
|
1 |
In the Navigation pane, click Job Status. |
|
3 |
On the Monitor Job page, you can view the following information: |
|
• |
Job details: This area displays the following details: job title, job ID, instance ID, phase number, client name, plug-in name, status, start time, expected completion time, time elapsed, size of data moved and data transfer chart, current transfer rate and data transfer chart, peak transfer rate, and average transfer rate. The fields: waiting for device, elapsed transfer, estimated transfer remaining, and estimated time remaining are also displayed when running a job using Plug-in for NDMP. The fields: waiting for device and elapsed transfer are also displayed when running a job using Plug-in for SnapMirror to Tape. However, the field ‘expected completion time’ is not displayed when running a job using Plug-in for NDMP and Plug-in for SnapMirror to Tape. |
|
• |
Job logs: This area displays the log messages generated for the job. By default, the table is sorted by date and time. You can sort the table by one or more columns, as required. For more information, see Sorting records in NetVault WebUI. |