Converse agora com nosso suporte
Chat com o suporte

Foglight for Application Operations 5.9.8.5 - User Guide

Introducing Foglight APM Monitoring Transactions Examining Response Times Examining Error Breakdowns Viewing Real User Activity from a Geographical Perspective Using the SOC Transactions Tab Using the SOC for APM triage Creating Custom Drag-and-Drop Dashboards APM Tile and View Reference Appendix: Enabling End User Transactions from FxM and FxV

Database layer

Begin all investigations by looking at the multi-application table at the top of the SOC dashboard. Here you can see an overview of the service or tier, including name, service level compliance, and user health status.

Only one service is shown in this example, but in a typical environment, there would be several.

2
Review the Transactions tab to determine the impact on users.
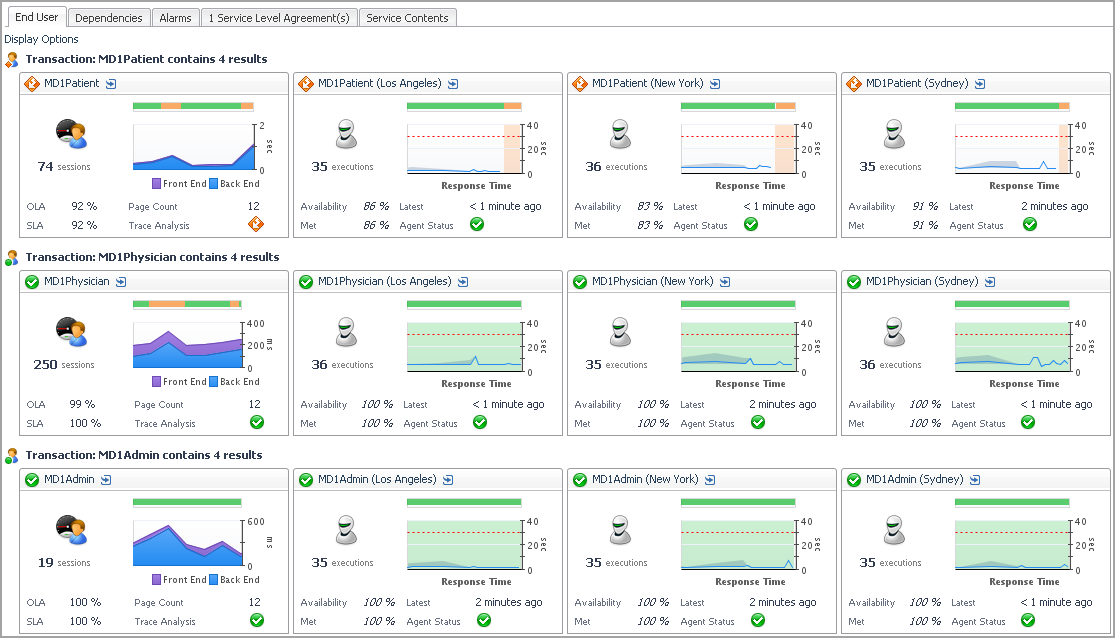
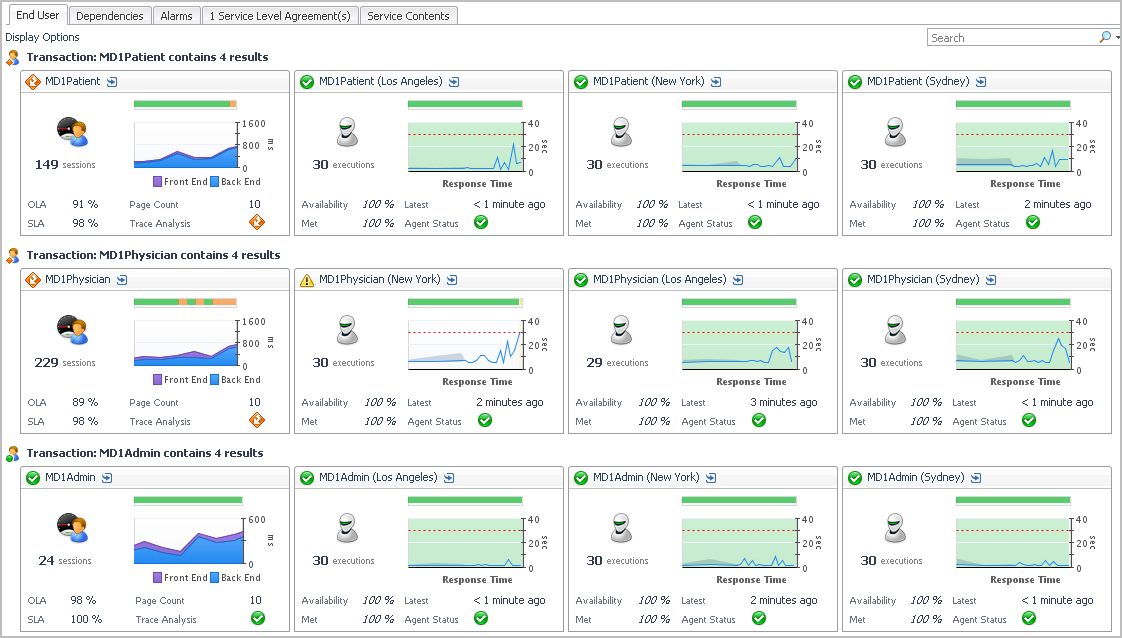
End user tiles are grouped by transaction: MD1Patient (top row), MD1Physician (middle row), and MD1Admin (bottom row). They are also ordered by severity (that is, the users with the worst health status or most alarms appear at the top).
Here you see that one transaction is having an issue, with both the real user tile and synthetic tiles reflecting an issue when accessing MD1Patient. The users accessing MD1Physician and MD1Admin are not experiencing any issues (their status is green across the board), which indicates that the issue is not affecting the whole application, only the MD1Patient transaction.
The Trace Analysis health status () icon on the MD1Patient Real User tile indicates that there is a problem somewhere in the trace analysis metrics.
Foglight has also generated critical level alarms () for all four MD1Patient transactions. Since all synthetic transactions are affected, this is not a location-specific issue. Synthetic transactions can be used as a benchmark for healthy performance. In this case, the fact that the synthetics are affected indicates that this is not a problem caused by a one-time error from a single user; it is a recurring or ongoing problem affecting all users.

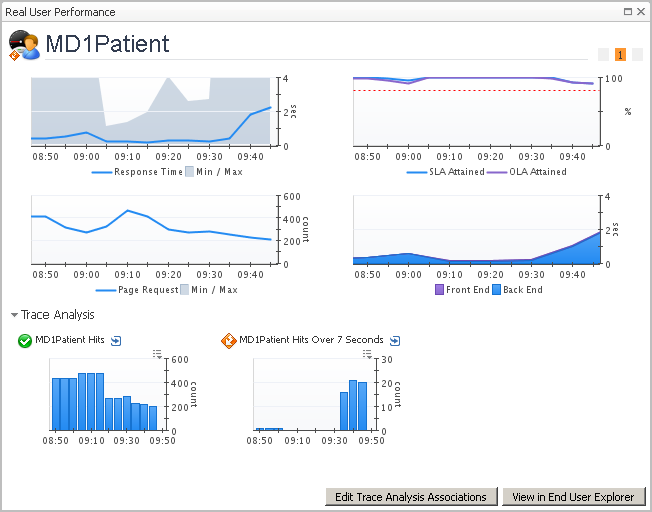
Beginning at 09:35, users are experiencing a longer response time.

At 09:35, the number of page requests is slightly lower than earlier peak loads. This indicates that the problem is not due to a spike in user activity.

Also at 09:35, the Service Level Agreement (SLA) and Operating Level Agreement (OLA) are still being met, but the percentage is decreasing.

The time the transaction spent in the back end (that is, in the supporting architecture) has increased, and the problem appears to have started shortly before users were affected (that is, before 09:35).

The overall number of hits has decreased, as shown in the MD1Patient Hits chart.

The number of users experiencing delay of more than seven seconds in their transaction execution has increased, as shown in the MD1Patient Hits Over 7 Seconds chart.

NOTE: Click the title bar of the MD1Patient Hits Over 7 Seconds chart to drill down into the individual sessions recorded by FxV. The FxV details allow you to see the Hit URLs and error messages, and to drill down into individual sessions, where you can step through a session to locate the error point.
In this case, drilling down to the sessions shows that this is a content error issue. Some users are seeing error messages in their web browsers. This increases the priority of this issue.
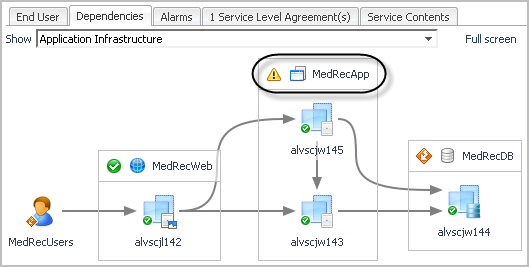
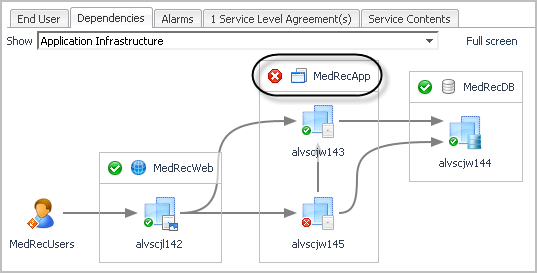
Click the Dependencies tab to view the application topology.
Figure 38. Dependencies tab
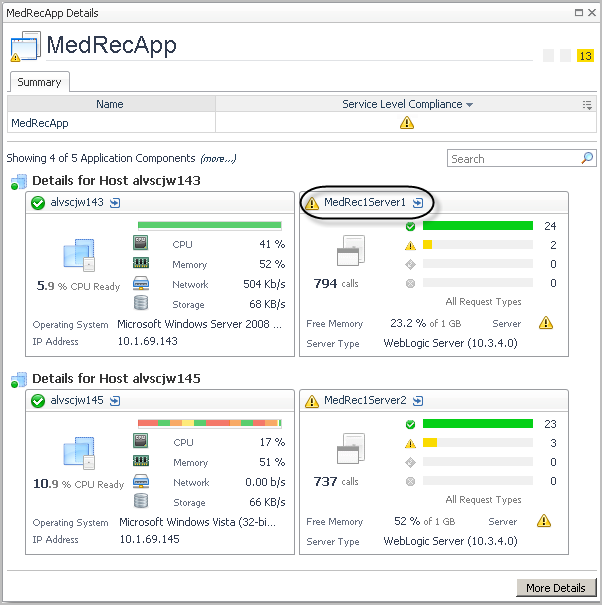
The MedRecApp Details view opens. The banner section of the Summary tab displays the service level compliance for the tier. The lower portion of the view contains a tile for each application component, grouped by host.
Figure 39. MedRecApp Details view
On the Request Types tab, you see that POST/medrec/patient/viewPatient.action is the source of the warning. Select this request.
TIP: Use the Search box to filter the list of requests. Type medrec/patient to include only those requests with that string in the name.
7
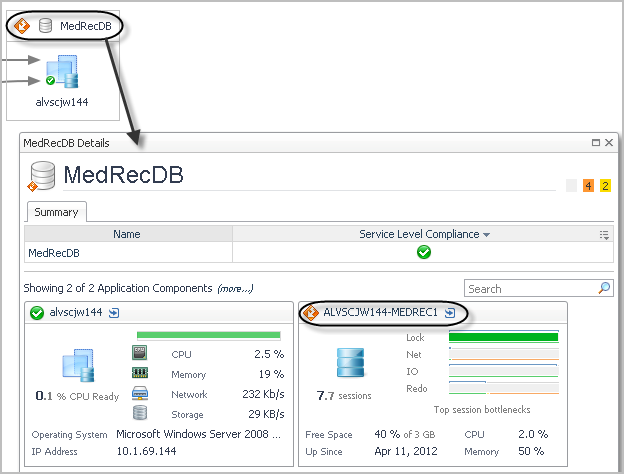
On the Dependencies tab, click the title bar of the MedRecDB database tier to drill down for more details.
The Oracle tile displays the top four session bottlenecks as color-coded bars. The larger the main color bar, the higher the percentage of resources were spent on that metric. The thin blue lines on the top of each bar indicate the range for the normal state. The thin green/yellow/orange bar below the main color bar indicate the metric’s trend compared against itself.

In this scenario, the database and application administrators should have been aware of the problems before the Application Performance Manager became involved. If the administrators were using Foglight, they would have received alarms generated and sent by Foglight.

Application layer

Begin all investigations by looking at the multi-application table at the top of the SOC dashboard. Here you can see an overview of the service or tier, including name, service level compliance, and user health status.

2
Review the Transactions tab to determine the impact on users.
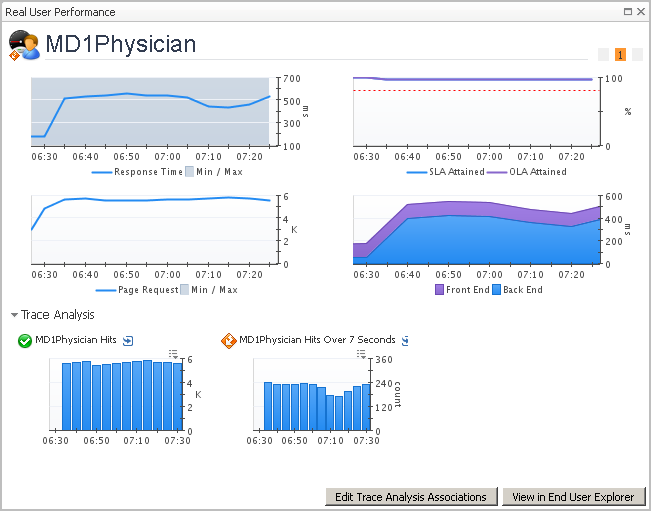
Here you see that Real Users are experiencing an issue when accessing MD1Physician, but the problem is only visible in the Trace Analysis. Synthetic transactions are not experiencing this problem.
The Trace Analysis health status () icon on the MD1Physician Real User tile indicates that there is a problem originating in a traced request.

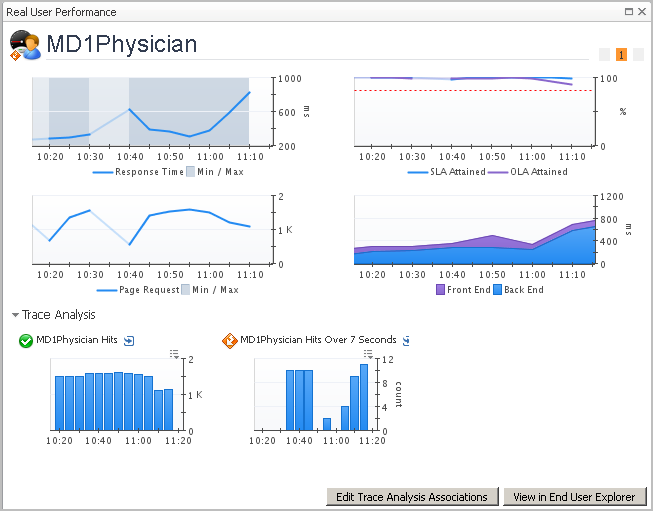
Starting at 06:30, the response time has increased slightly, but the increase is constant.

The number of page requests increased slightly before the response time increased, and has remained high. This indicates an increased load, not just a single spike in user activity.

The Service Level Agreement (SLA) and Operating Level Agreement (OLA) are still being met. The majority of users are not experiencing any problems.

The time spent in both the front end and back end (infrastructure) has increased, with the larger portion of the time being spent in the back end.

The MD1Physician Hits Over 7 Seconds chart shows the number of users experiencing a delay of more than seven seconds in their transaction execution has increased and remains high.
This indicates that a handful of outlier transactions are severely impacting these users, but other users remain unaffected.

TIP: Click the MD1Physician Hits Over 7 Seconds chart to drill down to the user sessions in FxV.
4
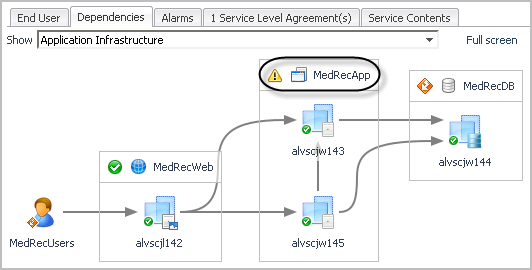
Click the Dependencies tab to view the application topology.
Figure 45. Dependencies tab
5
Click the MedRecApp application tier title bar to drill down for more details.
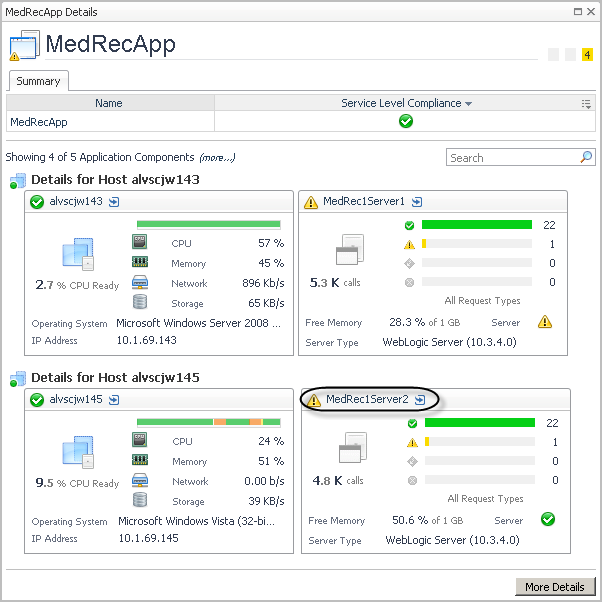
The MedRecApp Details view opens.
Figure 46. MedRecApp Details view
Here you can see that both nodes in the WebLogic® Server cluster (MedRec1Server1 and MedRec1Server2) are experiencing a problem with requests. The hosts are unaffected.
6
Click the title bar of the MedRec1Server2 application component tile to open the Application Details view.
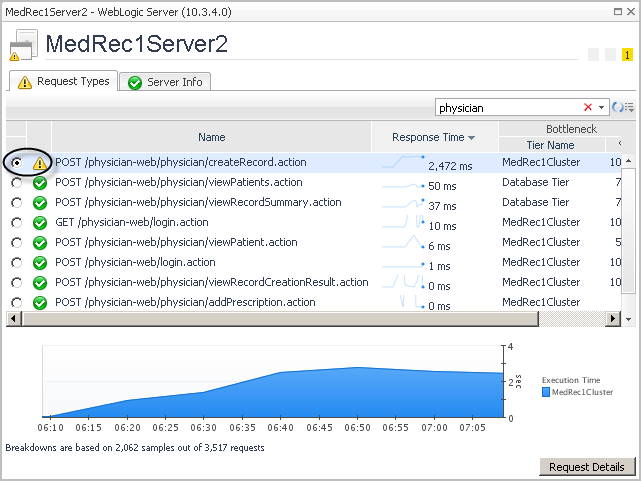
On the Request Types tab, you see that POST/physician-web/physician/createRecord.action is the source of the warning. Select this request.
TIP: Use the Search box to filter the list of requests. Type physician to include only those requests with that string in the name.
The response time for this request has increased and remains high. The Bottleneck Tier Name column lists the MedRec1Cluster tier as the source of the bottleneck.
The Execution Time chart below the list of request types also indicates that the most time is spent in the MedRec1Cluster of the application tier.
This evidence points to a problem in the Java code, but requires further investigation.

Virtual machine

Begin all investigations by looking at the multi-application table at the top of the SOC dashboard. Here you can see an overview of the service or tier, including name, service level compliance, and health status for selected tiers.

1
Review the Service Level Compliance, User, and App columns of the table.
2
Review the Transactions tab to determine the impact on users.
Real users for two of the three transaction types (MD1Patient and MD1Physician) are affected. The response time is increasing, and the OLA and SLA for these users are not being fully met. The Trace Analysis health icon indicates a problem somewhere in the traced requests.
3
Click the title bar of the MD1Physician Real User tile to drill down for more information.
The number of requests taking over seven seconds (MD1Physician Hits Over 7 Seconds) is increasing.
4
Click the Dependencies tab to view the application topology.
Figure 51. Dependencies tab
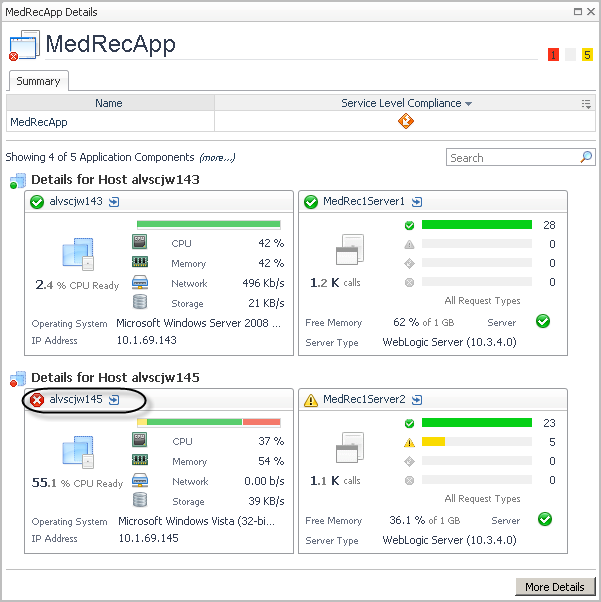
Figure 52. MedRecApp Details view
The first host in the tier (alvscjw143) and the application server on that host (MedRec1Server1) are both healthy.
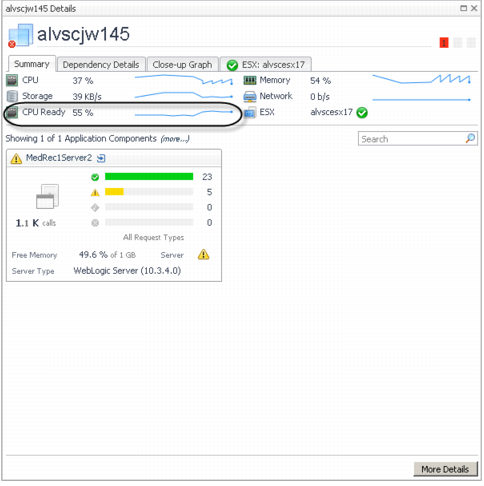
The other host (alvscjw145) is in a fatal condition. The CPU Ready percentage on this host is very high, at 55.1%, indicating a CPU starvation issue, which appears to now be impacting the ability of the MedRec1Server2 application server to process its requests effectively.
TIP: You could click the title bar of the MedRec1Server2 tile to drill down to the requests. In some cases, the requests can also provide more evidence to support your conclusions about the source of the issue.
6
Figure 53. alvscjw145 Details view
7
Click the ESX tab to investigate the state of the host server and the virtualization layer.
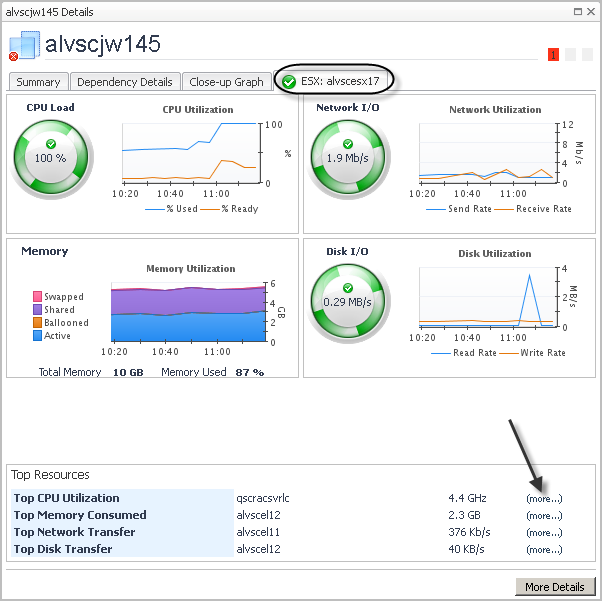
Figure 54. ESX tab
Here you can see the top resource usage on the ESX® host. The CPU Load is at 100% Used, and has been for some time.
8
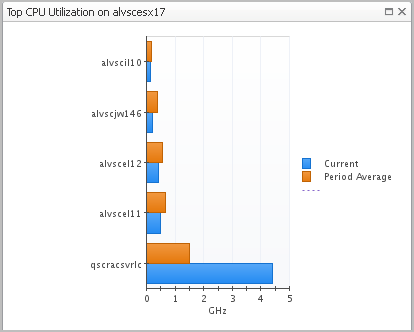
Click the (more...) link for the Top CPU Utilization to compare the CPU usage of the hosts on this server.
The bar chart makes it easy to see the VM (qscracsvrlc) that is currently consuming the most CPU resources. It has also been hogging the CPU resources over the entire period.


Creating Custom Drag-and-Drop Dashboards

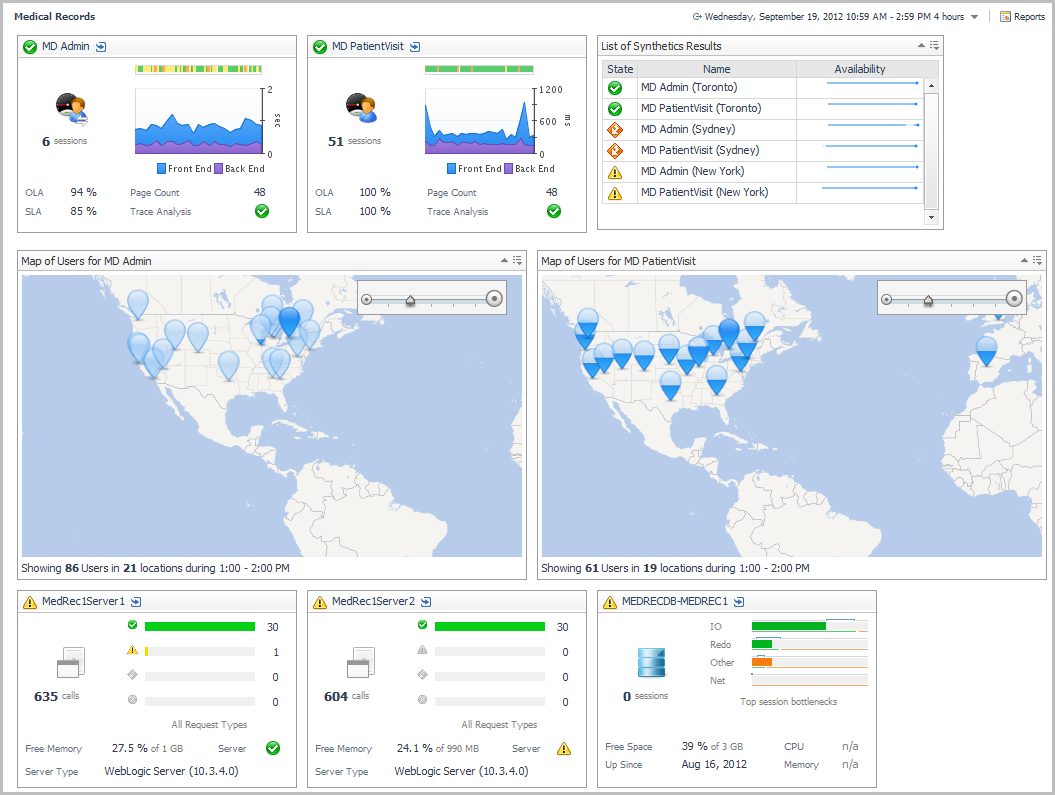
You can quickly and easily create a drag-and-drop dashboard to customize the view you want to use for triage with a specific application. This can be helpful when you want to:

For example, suppose you have a service that includes summarized data from a number of different locations, and you want to visualize this at-a-glance, relative to their geographic location. The procedures that follow walk you through creating such a dashboard, adding view elements for Real User and Synthetic transactions, and adding map components.

2
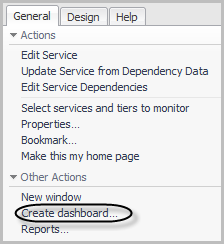
In the Other actions section of the action panel, click Create dashboard.
3
Select Use All Data (the default setting) and click Next.
5
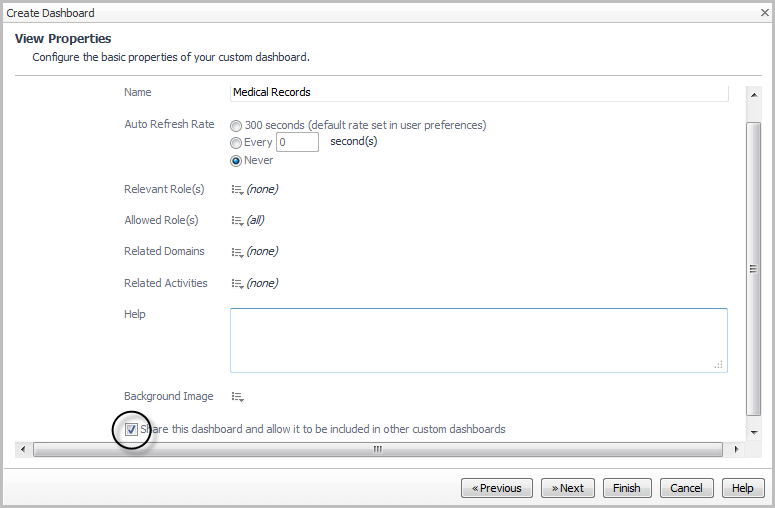
Select the Share this dashboard and allow it to be included in other custom dashboards check box.
6
Click Next.
8
Click Finish.
2
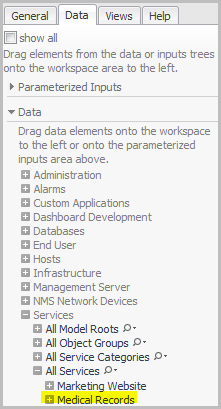
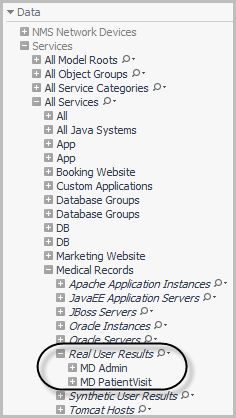
In the Data list, expand Services > All Services.
4
Expand Real User Results and select the application component (for example, MD Admin).
6
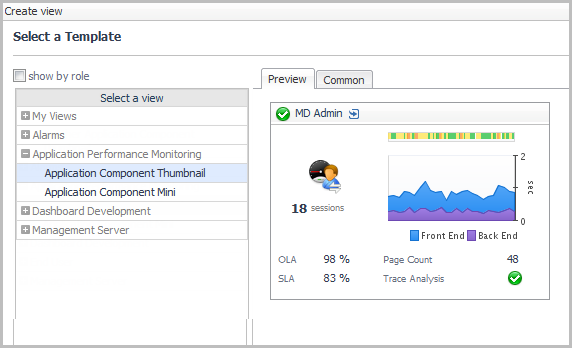
Click Select a view. The Create View wizard opens.
8
Click Finish.
10
From the menu that opens, click Use previous selection.
1
From the Data list in the action panel, drag and drop Synthetic User Results onto the dashboard display area.
2
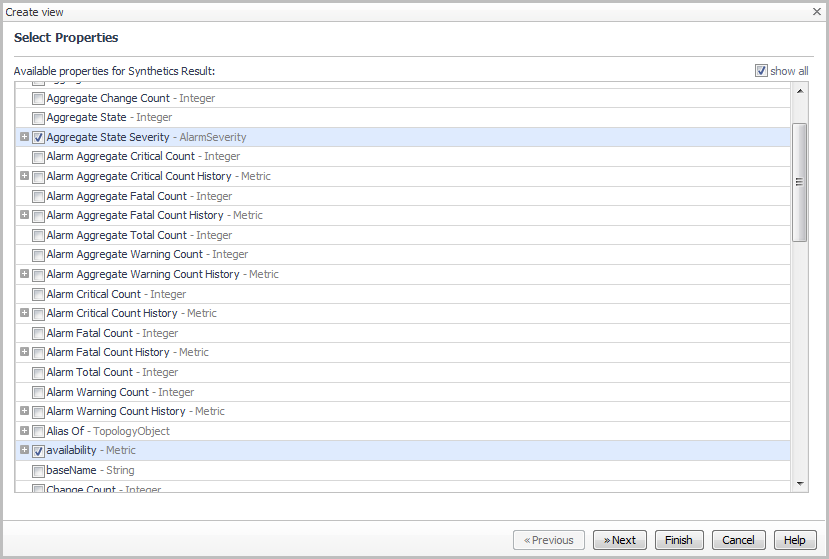
From the menu that opens, select Create a table. The Create View wizard opens.
5
Click Next.
6
On the Configure Columns page, click in the Renderer box for the availability property and select Sparkline from the list.
7
Optional — Click in the Label box for the Aggregate State Severity property and type State.
8
Optional — Click in the Label box for the availability property and type Availability.
9
Click Next.
12
Click Edit page layout.
15
Click Done to lock the views in place and continue adding views.
4
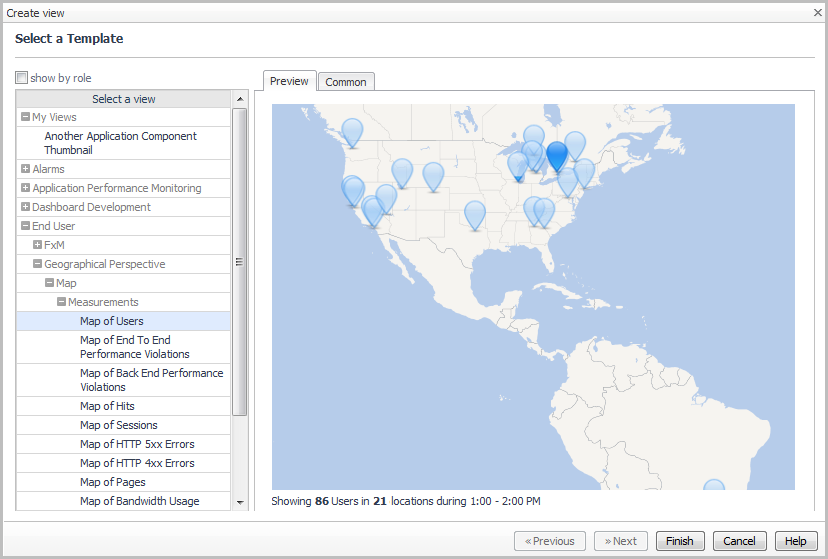
Expand End User > Geographical Perspective > Measurements.
5
Select Map of Users.
6
Click Finish.
8
From the menu that opens, click Use previous selection.
10
Click Edit page layout.
2
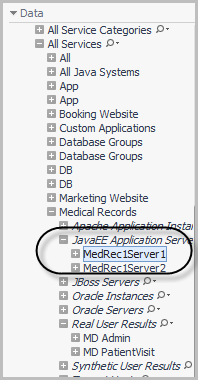
Drag and drop an application server from the JavaEE Application Servers list (for example, MedRec1Server1).
4
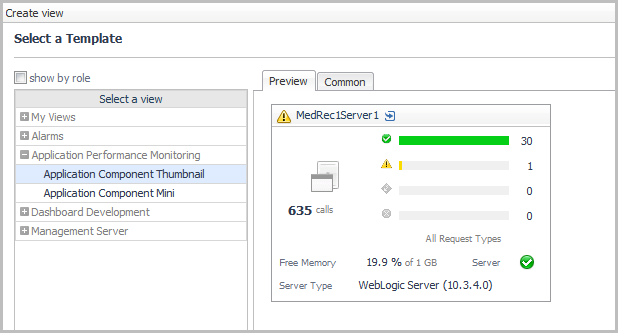
Expand Application Performance Monitoring and click Application Component Thumbnail.
5
Click Finish.
7
On the menu that opens, click Use previous selection.
9
Expand Oracle Instances and drag and drop a database server instance onto the dashboard (for example, MEDRECDB-MEDREC1).
11
12
Click Finish.

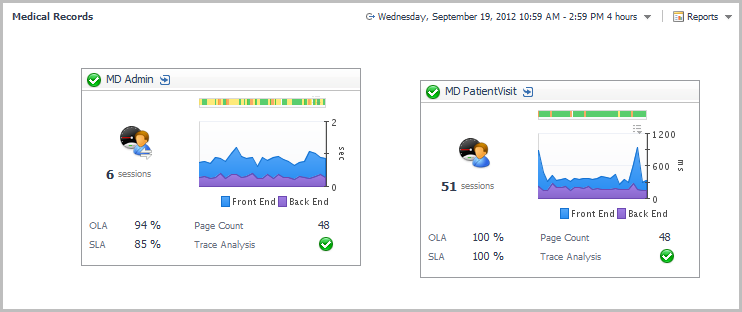
The at-a-glance custom dashboard is now complete.

You can link this dashboard to the Explore icon for the service it represents on the Service Operations Console. For more information, see Linking a custom dashboard to the Explore icon for a service.

Documentos relacionados

The document was helpful.

Selecione a classificação

I easily found the information I needed.

Selecione a classificação