Mapping datasources
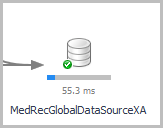
By default, datasources appear on the Response Time Breakdown tab with limited information. If you know the proper type of a datasource (for example, if it is an Oracle® database), you can map the datasource to a specific application component. A correct mapping provides access to drill down information, such as host or database metrics.
|
1 |
|
2 |
Click the Response Time Breakdown tab. |
|
4 |
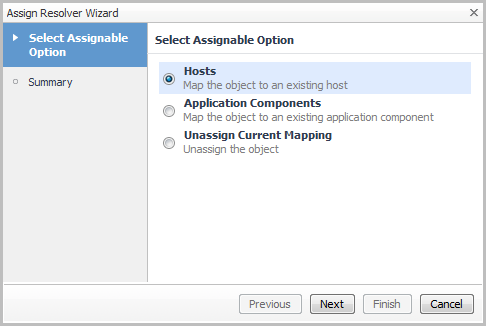
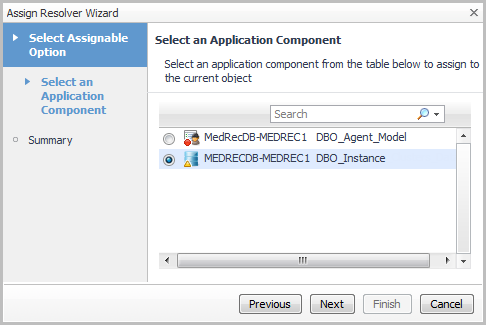
Click Map to Application Component. |
|
1 |
|
3 |
Click Finish. |
|
1 |
|
3 |
Click Next. |
|
4 |
Click Finish. |
|
1 |
Select Unassign Current Mapping. |
|
2 |
Click Next. |
|
3 |
Click Finish. |
Examining Error Breakdowns
For an overview of how to use this dashboard, see Investigating error breakdowns.
For more information, see Configuring Response Time Breakdown settings.
Investigating error breakdowns
|
• |
On the navigation panel, under Dashboards, click APM > Error Explorer. |
The Error Breakdown Explorer dashboard opens.
|
• |
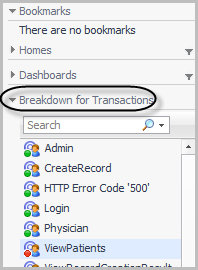
Open the navigation panel and select a transaction from the Breakdown for Transactions list. |
For more information, see the following topics:
Requests with errors in the selected timeslice
On the Errors tab, you can see what the error was. For example:


