
Introducing Foglight APM
Monitoring Transactions
Investigating real user APM transactions
Investigating application server transactions
Configuring display options
Examining Response Times
Investigating response time breakdowns
Configuring Response Time Breakdown settings
Additional configuration options
Examining Error Breakdowns
Viewing Real User Activity from a Geographical Perspective
Using the SOC Transactions Tab
Exploring the SOC Transactions tab
Exploring response time breakdowns from the SOC
Configuring display options
Using the SOC for APM triage
Creating Custom Drag-and-Drop Dashboards
APM Tile and View Reference
Overview of APM tiles
Application Servers - .NET tile
Application Servers - Java tile
DB2 tile
Host tile
JMX tile
MQ tile
Oracle tile
OS tiles
Pivot tiles
Real User (APM) tile
Real User (FxM) tile
Sequence tile
SQL Server tile
Sybase tile
Synthetics tile
Virtual Hyper-V tile
VMware tile
Overview of Detail views
Application Server detail view
Host detail view
Pivot Breakdown detail view
Real User (APM) Performance detail view
Appendix: Enabling End User Transactions from FxM and FxV
Hits and Pages tabs
Response Time Breakdown tab
Application Infrastructure tab
Related Infrastructure tab
Real User (FxM) Performance detail view
Synthetic Result detail view
Synthetic User Performance detail view
Virtual Machine detail view
Topology object name reference table
Real User (FxM) Performance detail view
To access this view, click the title bar of a Real User (FxM) tile, or from the Geographical Perspectives dashboard, click Transaction Detail for an FxM transaction.
For more information, see the following topics:
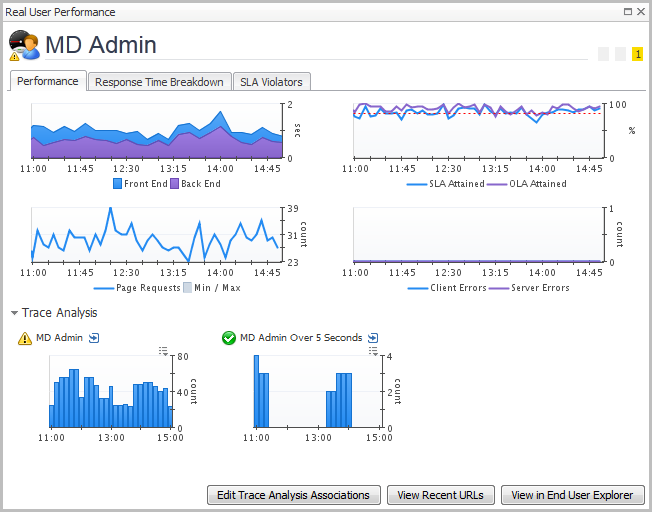
Performance tab
The Performance tab displays charts of performance metrics and trace analysis information.
Figure 89. Example of the Performance tab view
|
• |
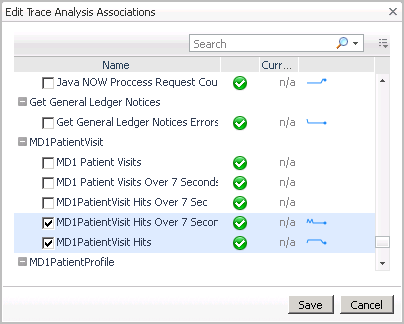
Click Edit Trace Analysis Associations to view and edit the state of the available counters that represent statistics for the monitored application. Select one or more of the available counters in the Edit Trace Analysis Associations dialog box to display their statistics in the Real User Performance detail view, under Trace Analysis. |
Figure 90. Edit Trace Analysis Associations dialog box
|
• |
Click View Recent URLs to drill down to the Foglight Experience Monitor (FxM) views and data. |
|
• |
Click View in End User Explorer to see the application statistics in the End User Explorer dashboard. For more information about this dashboard, see the Foglight Experience Monitor Cartridge User and Reference Guide. |
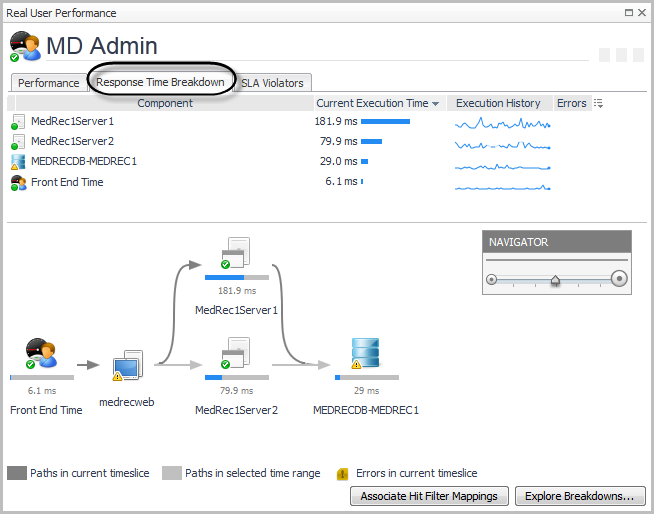
Response Time Breakdown tab
|
• |
Click Associate Hit Filter Mappings — see Associating FxV hitfFilter mappings for response time breakdowns for details. |
|
• |
|
TIP: If you click a datasource component icon, the details view also includes a Map to Application Component button. For more information, see Mapping datasources. |
|
• |
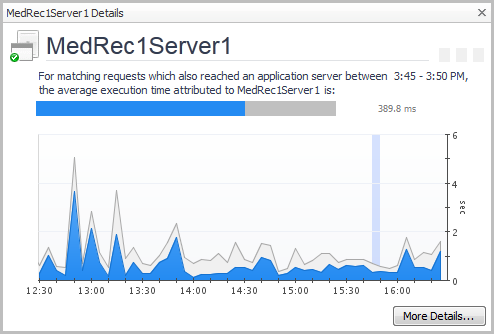
Click More Details to drill down to a detailed view of the selected application component. For example, from an application server component, you can access the Java™ application server details view. |
SLA Violators tab
|
NOTE: This view is only available if the specific application has been configured for mapping, and you have configured a map agent. For more information, see Prerequisites for using the Geographical Perspective dashboard, and Associating FxV hitfFilter mappings for response time breakdowns. |
Figure 93. Example of the SLA Violators tab view

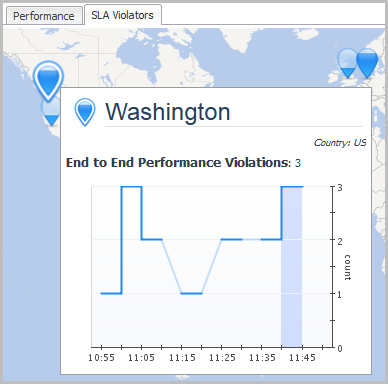
Click a location indicator to open the Location Detail view for that location. For more information, see Viewing Real User Activity from a Geographical Perspective.
Click More Details on the SLA Violators tab to open the Geographical Perspective dashboard. For more information, see Viewing Real User Activity from a Geographical Perspective.