Working with a Simple Matrix
|
|
The Simple Matrix requires that you have an Association Type defined between the two Object Types you want to show. |
A Simple Matrix can only be used on an Object Page, where one object is therefore the focus.
It creates a table which shows Associated Objects for the object in question as column headings, and then within the cells shows other objects that are also associated to those Associated Objects.
For example, if your Object Page was focused on a Process, you could use the Simple Matrix to show which Risk objects your Process is associated to, and then beneath each Risk also show which other Processes are also associated to those Risks.
|
|
When you use a Simple Matrix, the first level of Associated Objects are listed as columns in the table - consequently the more you show, the wider the table will be. We therefore recommend that you restrict the number of Associated Objects displayed in the Matrix or it may become unusable. |
To display a Simple Matrix in your Object Page:
|
|
These instructions assume that you are adding your Simple Matrix to a Tab on an existing Object Page, and that the new Tab node already exists. |
1.Right-click the Tab you want to add the Simple Matrix to, and choose New Association > [object-type] > [association-type]
This is to choose the Association Type you want to use to populate the column headings
An Association Type node is added.
2.Expand the Association Type node and switch the Layout to Empty.
To do this: Right-click the Layout and choose Switch Layout > CW > Empty
3.Right-click the Layout Empty node and choose Add Behaviors > Matrix > Matrix (Simple)
4.Right-click the Association Type node created at step 1 and choose New Association > [object-type] > [association-type]
This is to choose the Association Type you want to use to find out which other objects are associated to each Associated Object returned by the parent node.
An Association Type node is added.
5.Save your Site.
|
|
Please ensure you use unique Object Group IDs for the Association Type nodes. If you have IDs which are the same as ones you have used elsewhere, you will see an error reported when attempting to Deploy the Site. |
Working with an Advanced Matrix
|
|
The Advanced Matrix is used to display associations between two Object Types, and can be used on either an Index Page or an Object Page. |
To display an Advanced Matrix in an Index Page:
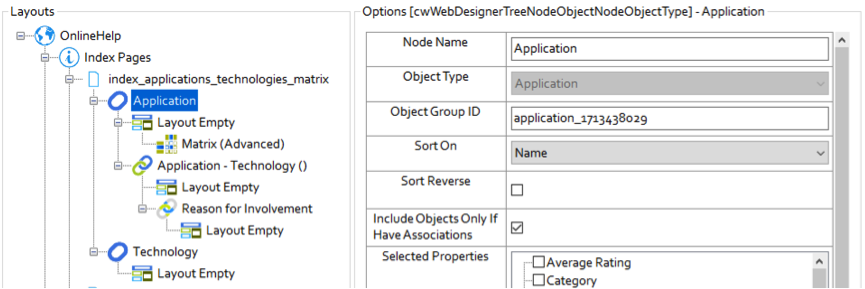
1.An Index Page can be added for an Object Type. In this example an Application has been added;
2.A related Object Type can also be added to the same Index Page. In this example a Technology has been added;
3.The first object type should have its Layout switched to Casewise > Empty, to allow a Matrix > Matrix (Advanced) Behaviour to be added. The second object type should have its Layout switched to Casewise > Empty, to prevent a list of these objects from being output.
The first object type will be the Row of the matrix, the second object type will be the Column.
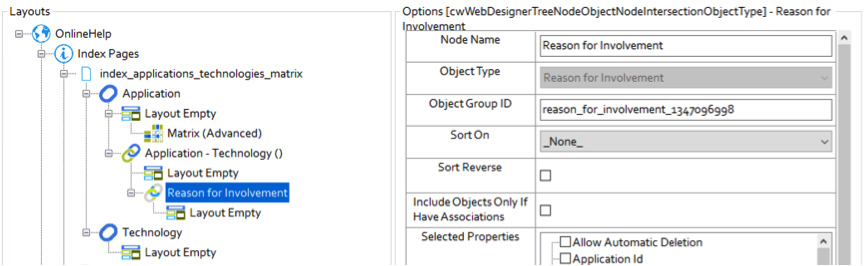
4.The first object type should identify the relationship to be represented in the Matrix. A New Association allows the relationship to the second object type to be selected. In this example the Application – Technology () has been selected;
5.The Association should identify its Intersection Object Type. In this example it is a Reason for Involvement;
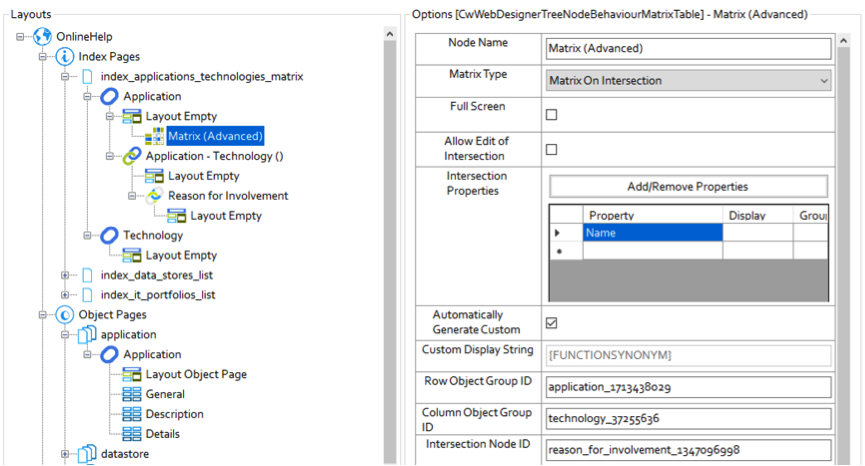
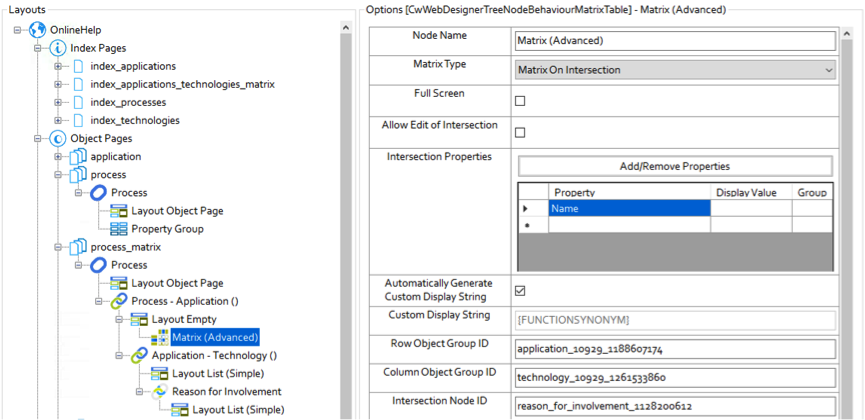
6.The Matrix (Advanced) behavior can now have its Intersection Properties added, and the Row Object Group ID and Column Object Group ID updated from the Application and Technology object types;
|
|
By default, the matrix cell will contain the {name} of the Intersection instance as its Display String, until Intersection Properties are added. In this example the Reason for Involvement has had its Name property added, which Automatically Generates the Custom Display String {FUNCTIONSYNONYM}. |
|
|
The Intersection Node ID is automatically updated when the Intersection Object Type is established. |
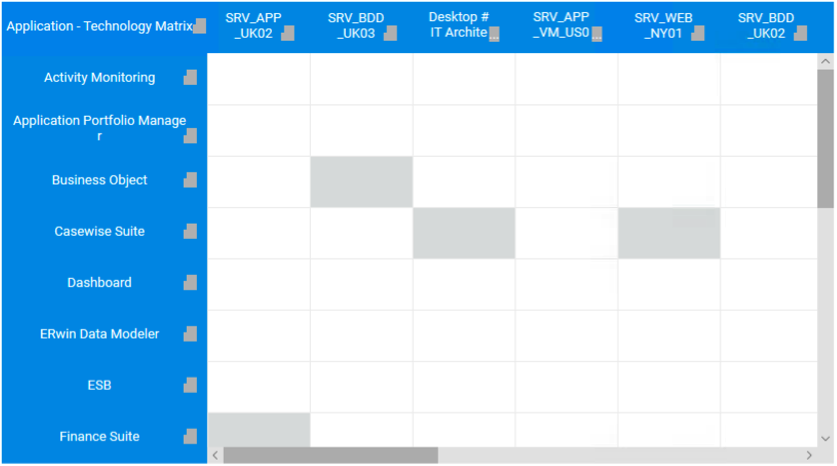
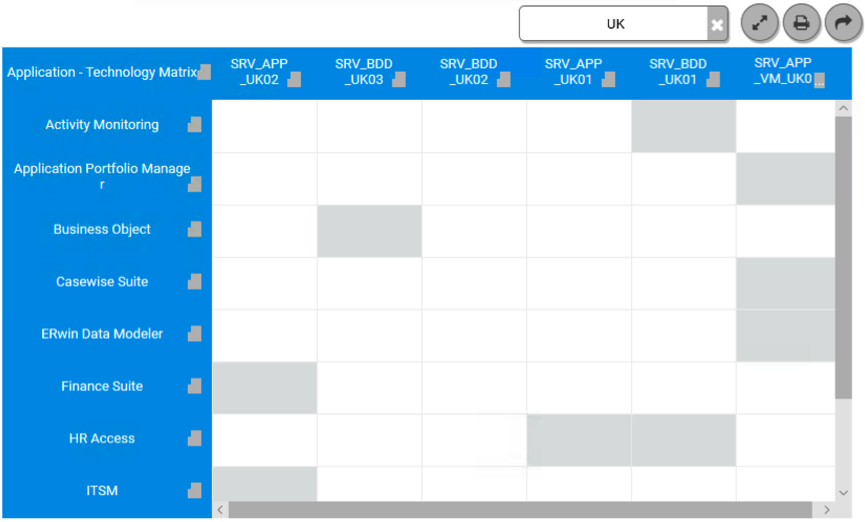
The Published Example Advanced Matrix:
|
|
Both Application and Technology object types have been restricted to Include Objects Only If they Have Associations. This will reduce the size of the matrix, and consequently the time it will take to refresh. |
Objects with Associations Only
|
|
It might also prove useful to Add a Page Filter to enable the size of the matrix to be reduced. An active filter is likely to reduce the time to generate the matrix. |
A Filtered Page
|
|
The Row and Column objects could be filtered to reduce the number of rows or columns. For example, the Applications could be filtered to only include those with a Category = ERP; |
Filtering Objects
|
|
A matrix with too many rows and columns could take an unacceptable amount of time to generate. |
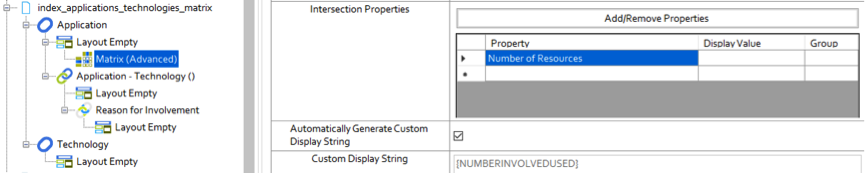
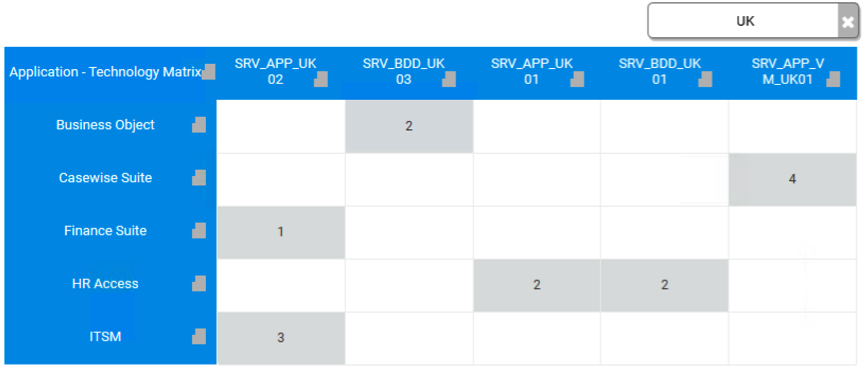
Displaying Intersection Properties:
In the example output above, the Custom Display String for each cell has been set to the Name of the Intersection object. None of the Reason for Involvement associations have been given a name, as a consequence the shaded cell contains no detail. The following example has the Number of Resources displayed in each cell:
Intersection Property
Number of Resources
To display an Advanced Matrix in an Object Page:
|
|
The Advanced Matrix on an Object Page is similar to one created for an Index Page, but like the Simple Matrix on an Object Page, the focus is on a single object. |
1.An Object Page can be added for an Object Type. In this example a Process is to be added.
2.This object type should identify a relationship to the objects to be represented in the matrix rows. A New Association is added under the object type. In this example a Process - Application () is to be added.
3.The related object type should have its Layout switched to Casewise > Empty, to allow a Matrix > Matrix (Advanced) Behaviour to be added.
4.The first related object type should now identify the relationship to be represented in the Matrix. A New Association allows the relationship to a second related object type to be selected. In this example the Application – Technology () is to be selected.
5.The Association should identify its Intersection Object Type. In this example it is to be a Reason for Involvement.
6.The Matrix (Advanced) behavior can then have its Intersection Properties added, and the Row Object Group ID and Column Object Group ID updated from theProcess – Application () and Application - Technology () nodes;
|
|
The need to reduce the size of the Object Page matrix is less likely, as only the objects related to the selected object, and their related objects will be included in the matrix. |
The Published Example Advanced Matrix:
An Application to Technology matrix for a selected Process;
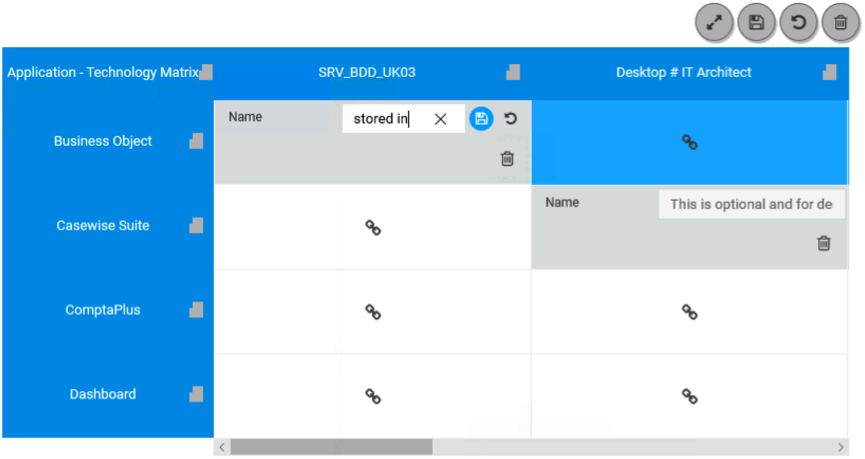
Editing Intersection Properties:
In the example output above, the Custom Display String for each cell has been set to the Name of the Intersection object. None of the Reason for Involvement associations have been given a name, as a consequence the shaded cell contains no detail. It is possible to Edit the Intersection Properties, by clicking on the Edit button above the matrix;
Editing the Name of an Intersection.
|
|
It is possible to create new relationships by clicking on the 'link' icon, or to delete existing relationships by clicking on the 'bin' icon. |
Working with Tabs based on Lookup Values
Tabs based on Lookup Values is a list-based display that organizes your objects into groups based on the value of 'Lookup' (drop-down) properties such as Category.
Vertical tabs on the left side of the page are used to represent the values, while the objects themselves in each tab are displayed in simple lists.
Objects listed using this display type cannot be edited directly.
You can optionally include an Overview Chart which creates an 'Overview' tab displaying a Pie Chart showing the proportion of each value. The Overview Chart is identical to the chart displayed when using the Pie Chart based on Lookup Value behavior.
|
|
The Tabs based on Lookup Values display requires that you have drop-down properties in your model. It will work with the default drop-down Category, as well as any user-defined drop-down properties in your model. |
To create an Index Page using Tabs based on Lookup Values:
1.Create a New Index Page with a List (Simple) layout
2.On the Object Type node, ensure you select 'Category' in the Selected Properties area
3.Right-click the Layout List (Simple) node and choose Add Behaviors > Navigation > Tabs on Lookup Values
A Tabs on Lookup Values node is added below the Layout node.
4.Select the Tabs on Lookup Values node and enter the Scriptname of the drop-down property you want to refer to in the Filter Lookup field
You can find the Scriptname in Model Explorer's Design View. The scriptname for the default Category drop-downs on objects is always 'TYPE'.
5.Use the following optional settings:
- Use Overview Chart to specify that you want the first tab to be an Overview tab showing a Pie Chart summarizing the distribution of the values
- Use Not Display Undefined to specify that the page should not include or display any objects that has a value of 'Undefined'.
6.Save your Site.
|
|
Remember to add a Menu item for your new page. |
Filtering Data