Log messages contain information that can be used for diagnosing and troubleshooting problems. When you report a problem, Quest Technical Support might request you to provide the log dump file. You can use the Download or Export method available on the View Logs page to generate the log dump file. For more information, see Downloading logs or Exporting logs.
|
Diagnostic information is written to trace files. Each process generates its own trace file. By default, trace files are stored in the trace-container directory under the NetVault Backup installation directory. For more information, see Diagnostic tracing. |
Log messages that are older than 30 days are automatically purged from the database. You can use the configuration settings for Logging Daemon to change the maximum age for log messages. You can also manually delete the log messages by using the Purge Logs method available on the View Logs page.
You can view the log messages from the View Logs page. From this page, you can perform various log-related tasks, like download or export log messages, set log events, or purge log messages.
|
1 |
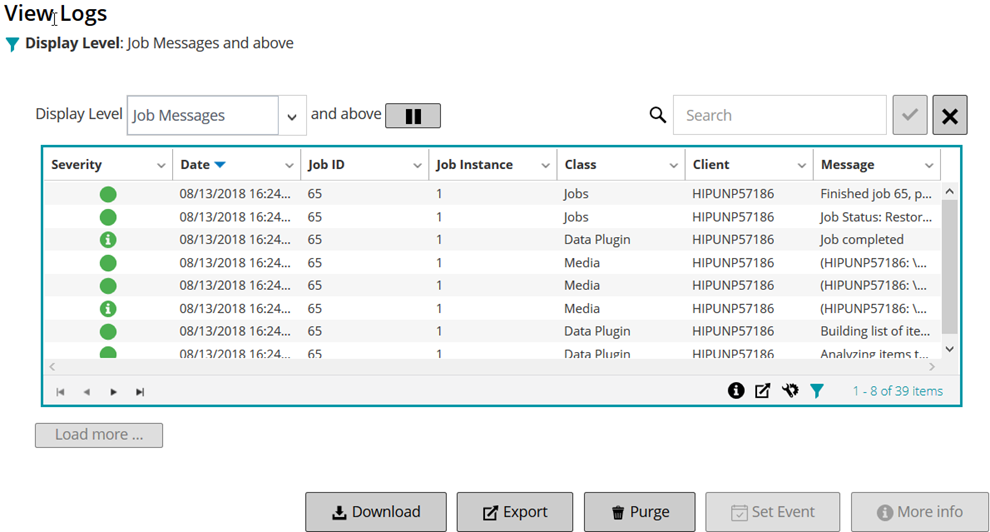
In the Navigation pane, click View Logs. |
|
2 |
On the View Logs page, you can view the log messages generated by various processes. |
|
• |
Severity: Severity level of the message. |
|
• |
Date: Sate and time when the log was generated. |
|
• |
Job ID: Job identification number. |
|
• |
Class: Type of operation that generated the logs. |
|
• |
Client: Name of the client for which the log was generated. |
|
• |
Message: Detailed log message or description. |
|
|
||
|
|
Log messages related to media, scheduler, and system activities. | |
|
|
||
|
|
||
|
|
||
|
|
Critical problems that might have caused an operation to fail. |
|
To view the context information, click anywhere in the Severity column. Alternatively, select the message, and click More Info. The dialog box that appears can include data transfer details, execution scripts, or other information. After reviewing the details, click OK to close the dialog box. |
|
5 |
You can use the Display Level option to filter the messages based on their severity level. When you specify the severity level, the messages at that level and higher are displayed on the View Logs page. |
|
6 |
The View Logs page loads a maximum of 10,000 records initially. The total number of records fetched is displayed at the lower-right corner of the table. |
When investigating a reported problem, Quest Technical Support might request you to provide the log dump from the NetVault Backup Server. You can generate the dump file by using the Download or Export method available on the View Logs page.
The Download method creates dump files on the local machine where the WebUI is running. This method is useful if you are accessing the server from a remote machine. The Export method creates the file on the NetVault Backup Server. For more information about this method, see Exporting logs.
|
1 |
In the Navigation pane, click View Logs. |
|
2 |
|
• |
Binary Log: Select this option to export the logs to a binary file (“.nlg”). |
|
• |
Text Log: Select this option to export the logs to a text file. |
|
• |
Database Table Dump: Select this option to export the logs to a PostgreSQL dump (pg_dump) file. |
|
3 |