|
a |
In the Navigation pane, click Job Status. |
|
b |
|
a |
|
c |
|
1 |
In the Navigation pane, click Job Status. |
|
3 |
On the Manage Job page, you can view the following information: |
|
• |
Job Details: This area shows the following information: job name, job ID, job type (backup or restore), and name of the client. |
|
• |
Configuration: This area lets you create, edit, and view the protection sets. It shows the selections, the plug-in options, schedule, source storage, target storage, and advanced options. To make changes to any of these details, click the corresponding edit icon. |
|
• |
Recent Instances: This table lists the recent instances of the job. It shows the following information: Run time, duration, job size, instance ID, phase ID, and status (Succeeded, Failed, Aborted, and others). |
|
4 |
To save your changes or submit the job for scheduling, click Save or click Save & Submit, respectively. |
|
5 |
If a new name was provided, the Save Job dialog box is displayed. Select the applicable option in this dialog box: |
|
• |
Save changes creating a new job using the supplied name: Select this option to save the changes to a new job. |
|
• |
Save changes renaming this job to the supplied name: Select this option to rename the existing job. |
|
6 |
Click OK. |
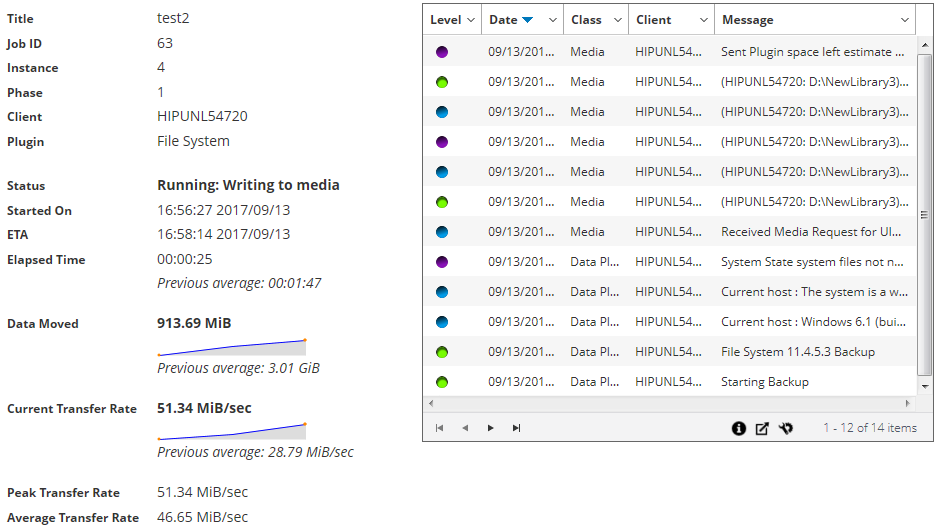
You can monitor the progress of a job from the Monitor Job page. The page displays the job status, data transfer rate, log messages, and other job details.
|
1 |
In the Navigation pane, click Job Status. |
|
3 |
On the Monitor Job page, you can view the following information: |
|
• |
Job details: This area displays the following details: job title, job ID, instance ID, phase number, client name, plug-in name, status, start time, expected completion time, time elapsed, size of data moved and data transfer chart, current transfer rate and data transfer chart, peak transfer rate, and average transfer rate. The fields: waiting for device, elapsed transfer, estimated transfer remaining, and estimated time remaining are also displayed when running a job using Plug-in for NDMP. The fields: waiting for device and elapsed transfer are also displayed when running a job using Plug-in for SnapMirror to Tape. However, the field ‘expected completion time’ is not displayed when running a job using Plug-in for NDMP and Plug-in for SnapMirror to Tape. |
|
• |
Job logs: This area displays the log messages generated for the job. By default, the table is sorted by date and time. You can sort the table by one or more columns, as required. For more information, see Sorting records in NetVault Backup WebUI. |
|
1 |
In the Navigation pane, click Job Status. |
|
• |
|
• |
|
• |