Foglight for Storage Management monitors EMC Isilon clusters. In the interface, clusters are categorized as Storage Arrays, and the nodes are called Member Nodes or simply Members.
|
1 |
On the navigation panel, under Dashboards, click Storage & SAN > Storage Explorer. |
|
2 |
On the navigation panel, under Topology, expand Storage Arrays and select an Isilon cluster. |
|
3 |
If the Alarm Count displays alarms, you may want to assess the alarms before continuing with this walkthrough. Click a status count to open a list of device and component alarms. For more information, see Assessing Storage Alarms. |
|
4 |
In the Summary tab, review performance in terms of key metrics. |
|
• |
Related Inventory. Contains alarm summaries for the selected storage array and its member nodes, external ports, internal ports, pools, and disks. |
|
• |
IFS Capacity. The chart displays IFS Capacity: Free and IFS Capacity Used for the IFS file system. In addition, the following metrics pairs are displayed: |
|
• |
Average CPU Busy %. Displays the aggregate value of % Busy for all nodes in the array over the time period. |
|
• |
File System Throughput. Plots Data Read Rate and Data Write Rate to the file system over the time period. |
|
• |
|
• |
External Network Throughput. Plots the Rcv Data Rate and Send Data Rate for the external network over the time period. |
|
TIP: If you prefer to see the Send Util (% of max) and Rcv Util (% of max) based on the rated maximum speeds of the ports (actual port speeds are not available from Isilon arrays) in the external network, ask your Foglight for Storage Management Administrator to edit the registry variable StSAN_StoragePortShowUtilMax and set ISLN_E_IP=true. |
|
• |
Internal Network Throughput. Plots the Rcv Data Rate and Send Data Rate for the internal network over the time period. |
|
• |
Clients. Plots clients connected versus clients that are actively using the network over the time period. |
|
• |
Summary and Resource Information. Displays physical details about the storage array. |
|
• |
Alarm Summary. Displays alarms on the storage array. |
|
5 |
Click the Network tab. |
|
• |
Charts. Plot aggregated values for Send Data Rate and Rcv Data Rate, and Packet Errors % for the external network connections over the time period. |
|
• |
Port Status Filter. Click this link to show only ports with a selected status in the Port Details table. |
|
• |
Port Details. For each port used by the external network, identifies the port name, parent node, status, physical state, and current values for Send Data Rate, Rcv Data Rate, and Packet Errors %. Also displays the maximum speed of the port. Click a |
|
NOTE: When the registry variable StSAN_StoragePortShowUtilMax is set to show port utilization, this table also displays Rcv Util and Send Util. |
|
• |
Alarm Summary. Displays alarms on ports used by the external network. |
|
• |
Charts. Plot aggregated values for Send Data Rate, Rcv Data Rate, and Packet Errors % for the internal network connections over the time period. |
|
• |
Port Status Filter. Click this link to show only ports with a selected status in the Port Details table. |
|
• |
Port Details. For each port used by the internal network, identifies the port name, parent node, status, physical state, and current values for Send Data Rate, Rcv Data Rate, and Packet Errors %. Also displays the maximum speed of the port. Click a |
|
NOTE: When the registry variable StSAN_StoragePortShowUtilMax is set to show port utilization, this table can also display Rcv Util and Send Util. |
|
• |
Alarm Summary. Displays alarms on the external network and its ports. |
|
6 |
Click the Member Nodes tab. |
|
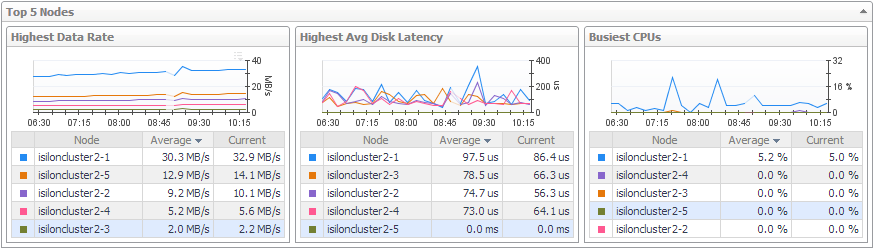
• |
Top 5 Nodes. Displays the top five member nodes with the highest average value for Data Rate, Latency, and % Busy. The charts plot values over the time period, while the tables show the average and current values for each node. |
|
• |
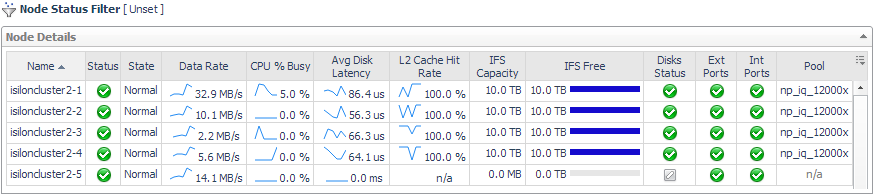
Node Status Filter. Click to show only member nodes with the selected status in the Node Details table. |
|
• |
Node Details. For each member node, displays its name, status, physical state, and current values for Data Rate, % Busy, Latency, L2 Cache Hit Rate, IFS Capacity, and IFS Capacity: Free. Also displays the worst status of the node’s disks, external network ports, and internal network ports, and identifies the node’s parent pool. Click a |
|
• |
Alarm Summary. Displays alarms on nodes. |
|
7 |
Click the Pools tab. |
|
• |
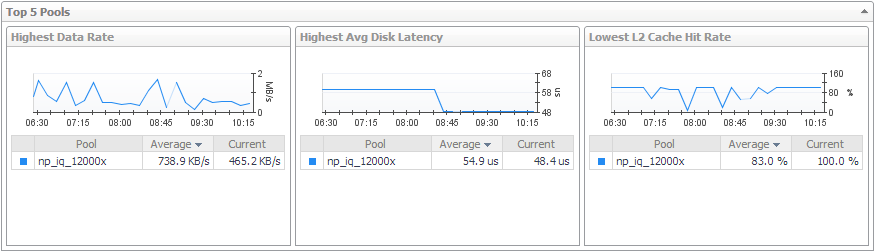
Top 5 Pools. Displays the top five pools with the highest average value for Data Rate and Latency, and the lowest average value for L2 Cache Hit Rate. The charts plot values over the time period, while the tables show the average and current values for each pool. |
|
• |
Pool Status Filter. Click to show only pools with the selected status in the Pool Details table. |
|
• |
Pool Details. For each pool, displays its name, status, and current values for Data Rate, Latency, L2 Cache Hit Rate, IFS Capacity, IFS Capacity: Free, HDD % Free, and SDD % Free. Also displays the tier that the pool belongs to and the worst status of nodes associated with the pool. Click a |
|
• |
Alarm Summary. Displays alarms on pools. |
|
8 |
Click the IFS tab. |
|
• |
Current Capacity Usage. For each pool or tier, displays the following sets of metrics: |
|
• |
File System. Plots Data Read Rate and Data Write Rate values and Read Ops Rate and Write Ops Rate values for the file system over the time period. |
|
9 |
Exported Directories. For each exported directory, states whether the directory is used in the monitored environment. When Used=true, you can click the directory name to view a topology diagram showing the datastores that mount the directoryClick the Disks tab. |
|
• |
|
11 |
Click the Advanced Find tab to investigate a Disk that is not included in the Top 15 items on the Disks. Use the Advanced Find functionality to query for the desired items. For more information, see Advanced Find. |
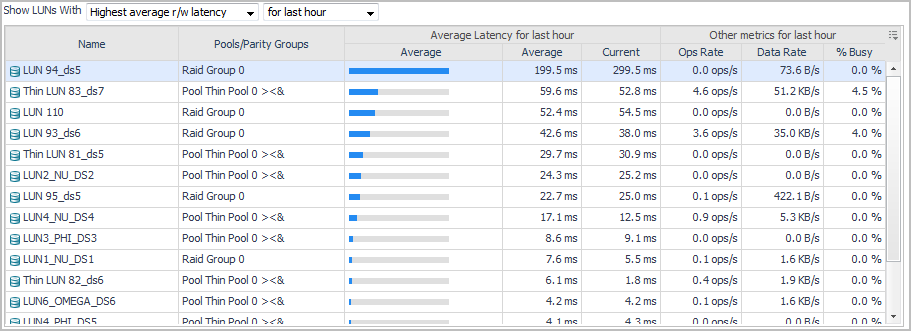
A LUN (logical unit) is the block storage element made available by an array or filer to a server.
|
• |
Alarm Summary. Displays alarms on LUNs, disks. To investigate further, click an alarm. See Assessing Storage Alarms. |
A LUN (logical unit) is the block storage element made available by an array or filer to a server.
|
• |
Alarm Summary. Displays alarms on LUNs, disks. To investigate further, click an alarm. See Assessing Storage Alarms. |
|
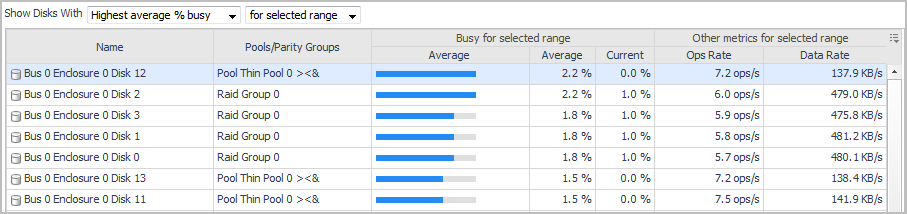
• |
Alarm Summary. Displays alarms on disks. To investigate further, click an alarm. See Assessing Storage Alarms. |