Chat now with support
Chat with Support

Foglight for Storage Management Shared 4.6 - User and Reference Guide

Getting Started Monitoring Storage Performance Investigating Storage Devices Investigating Storage Components Investigating VPLEX Storage Troubleshooting Storage Performance Managing Data Collection, Rules, and Alarms Understanding Metrics Online-Only Topics

Common Component Disk Tab Data

The Disks tab can be found on the following dashboards:

The Disks tab displays the physical disks associated with the selected entity.

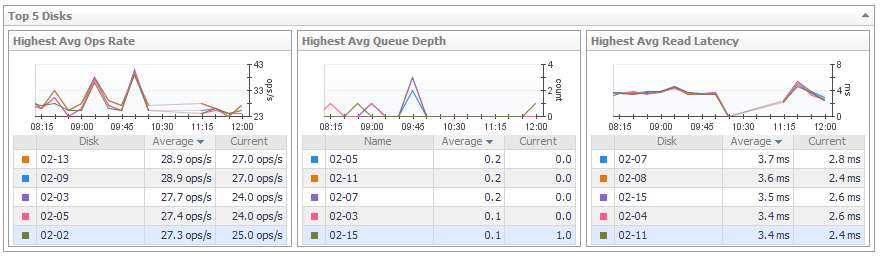
Top 5 Disks. Displays the top five disks with the highest average value for Ops Rate and the performance metrics most useful for this array or filer.
Disk Status Filter. Click to show only disks with the selected status in the Disk Details table.
Disk Details. For each disk, identifies its status, physical state, parent pool or aggregate, and Disk Size, and then displays current values for Ops Rate, % Busy, Average Queue Depth, Data Rate, and Latency. Click a Sparkline to plot metric values over the time period.
The remaining columns provide the following details:
-
Role. Displays the role played by the disk in the pool, such as disk or spare.
- RPM. Displays revolutions per minute as reported by the vendor.
- Disk Interface. When available, displays the type of interface, such as SATA or SCSI.
- Member. EqualLogic and Isilon only. Displays the name of the member node where the disk physically resides.
Alarm Summary. Displays alarms on disks.


Investigating VPLEX Storage

To gain a complete picture of the performance of a VPLEX storage device, you need to understand how its child components are performing.

This section covers the following topics:

Introducing VPLEX Virtualization Components Dashboards

The VPLEX Virtualization Components dashboard is a drill-down view that displays virtualization details about a selected VPLEX storage array, performance and capacity metrics, and alarms.

For information about each type of VPLEX Virtualization Components dashboard, see the following topics:

Investigating Director - Ports

The data displayed in the dashboard reflects values for the VPLEX storage over the selected time range. This walkthrough describes the contents of each of the tabs.

1
On the navigation panel, under Dashboards, click Storage & SAN > Storage Explorer.
2
In the Storage Explorer dashboard, click the director name in the Director table.
3
In the Summary tab, review performance in terms of key metrics.
Details. Displays physical details about the selected director.
Charts. Plot values over the time period for these metrics, if available: Ops Rate, Data Rate, % Busy, Frontend Abort, and Average Queue Depth.
Alarm Summary. Displays alarms on the selected director. To investigate further, click an alarm. See Assessing Storage Alarms.
4
In the Ports tab, Shows the history performance data of the port, including Ops Rate, Data Rate, and Latency.
1
On the navigation panel, under Dashboards, click Storage & SAN > Storage Explorer.
2
In the Storage Explorer dashboard, click the director name in the Port table.
3
In the Summary tab, review performance in terms of key metrics.
Details. Displays physical details about the selected port.
Charts. Plot values over the time period for these metrics, if available: Ops Total, Bytes Read, Bytes Write, Read Latency, and Write Latency.
Alarm Summary. Displays alarms on the selected port.To investigate further, click an alarm. See Assessing Storage Alarms.
Related Documents

The document was helpful.

Select Rating

I easily found the information I needed.

Select Rating