Chat now with support
Chat with Support

Foglight for Storage Management Shared 4.6 - User and Reference Guide

Getting Started Monitoring Storage Performance Investigating Storage Devices Investigating Storage Components Investigating VPLEX Storage Troubleshooting Storage Performance Managing Data Collection, Rules, and Alarms Understanding Metrics Online-Only Topics

Investigating a Virtual Volume

A Virtual Volume represents a logical SAN block storage device on an VPLEX array that can be exposed for mapping to a server. The data displayed in the dashboard reflects metric values for the Virtual Volume over the selected time range. This walkthrough describes the contents of each of the tabs.

1
On the navigation panel, under Dashboards, click Storage & SAN > Storage Explorer.
2
In the Storage Explorer dashboard, click the Virtual Volume in the Virtual Volumes Detail table.
3
In the Summary tab, review performance in terms of key metrics.
Details. Displays the Virtual Volumes’s status, physical details, parent device and capacity metrics.
Ops Chart. Shows the history Ops Rate of the virtual volume.
Data Rate Chart. Shows the history Data Rate of the virtual volume.
Latency Chart. Shows the history Latency of the virtual volume.Alarm Summary. Displays alarms on the VPLEX array.
Alarm Summary. Displays alarms on the selected virtual volume. To investigate further, click an alarm. See Assessing Storage Alarms.
4
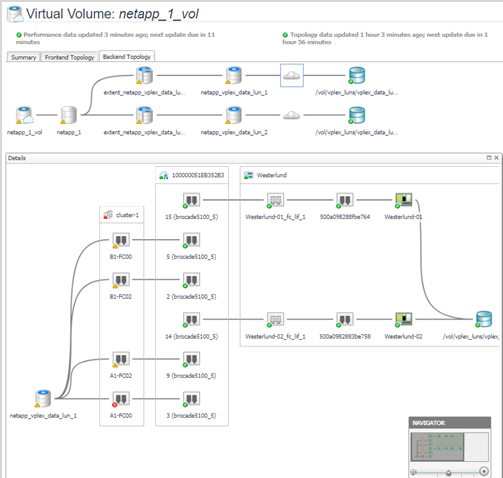
In the Frontend Topology tab, displays the dependency mapping from virtual machines to the virtual volume. Click a cloud node to display the network dependency mapping from VM disks to the virtual volume.
5
In the Backend Topology tab, displays the dependency mapping from the virtual volume to the destination LUNs. Click a cloud node to display the network dependency mapping from the virtual volume to the destination LUNs.

Investigating a Storage Volume

The data displayed in the dashboard reflects values for the selected storage volume over the selected time range. The Storage Volume dashboard has only one tab.

1
On the navigation panel, under Dashboards, click Storage & SAN > Storage Explorer.
2
In the Storage Explorer dashboard, click the Storage Volume in the Storage Volumes Detail table.
3
In the Summary tab, review performance in terms of key metrics.
Details. Displays the storage volume’s status, physical details, parent device, and size if available.
Alarm Summary. Displays alarms on the selected storage volume. To investigate further, click an alarm. See Assessing Storage Alarms.
4
In the Topology tab, displays the dependency mapping from virtual volumes to the storage volume, and the dependency mapping from the storage volume to destination LUNs. Click a cloud node to display the network dependency mapping from the storage volume to destination LUNs.


Troubleshooting Storage Performance

Administrators may receive problem reports from stakeholders about the performance of a VMware virtual machine (VM). When the suspected cause is storage, the Administrator can run an automated analysis using the Storage Troubleshooting dashboard. The analysis can quickly rule out a storage issue, allowing the Administrator to focus on other areas. Conversely, if a storage issue is found to be contributing to poor performance, the results of the analysis clearly highlights the datastores or RDM disk extents that require attention.

This section is intended for Foglight for Storage Management users with the role of Storage Administrator. It describes how to start an investigation, analyze the results, and change latency thresholds. It also summarizes the algorithm used to identify and assess storage performance issues.

This section describes the following topics:

Starting a Troubleshooting Investigation

Before beginning an investigation, you should ask the person reporting the issue the following questions:

1
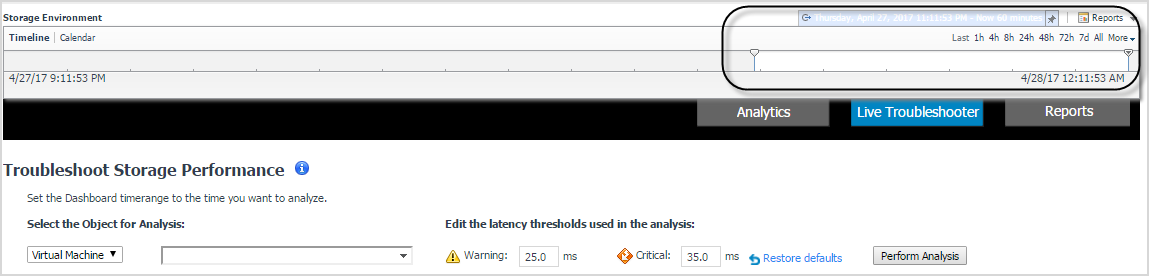
On the navigation panel, under Dashboards, click the Insights tab, and then click Live Troubleshooter.
5
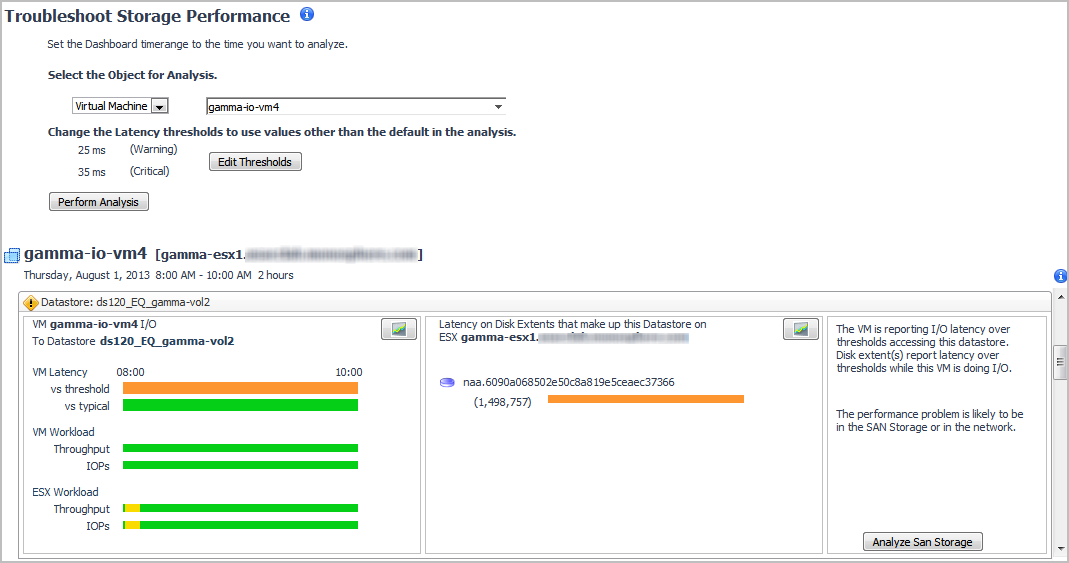
Click Perform Analysis.
If a Normal icon appears in all title bars, the performance issue is not storage-related. This investigation is complete.
If the Attention icon appears in one or more title bars, continue your investigation following the workflow described in Analyzing Storage Issues.
Related Documents

The document was helpful.

Select Rating

I easily found the information I needed.

Select Rating