Converse agora com nosso suporte
Chat com o suporte

erwin Evolve 360 Current - User Guide

Property Card


Navigation: erwin Evolve 360 User Help Guide > Item Views >

Property Card


Property Card

Property Cards are a way of displaying and interacting with individual pieces of data.

To create a Property Card:

          1. Click on All Views in the editor and then click on  icon placed at the bottom of the list of views.

          2. As the Property Card works like an Object Type View which returns the context from a single source.

For an instance, a Row layout is chosen, and configure a List View in the first row.

          3. To add Property Card in the second row,

Click Add Content > Add New View > Select Property Card.

          4. To pass the context from the source,

Click on the title of the layout and then Configuration from the toolbar.

Click Row 2.


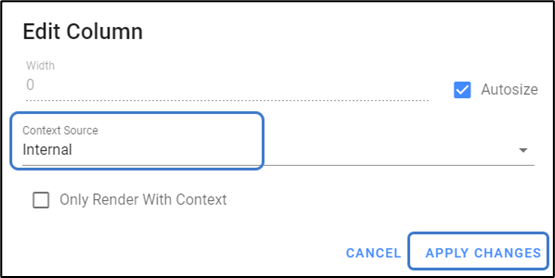
Click Context Source > Select Internal > Apply Changes.


The height of the Row can be adjusted manually by disabling Autosize and then enter the value in the field.


          5. The Preview of the configured Property Card is shown in the picture below.


By default, the property is set with Name. You can add the additional properties to the card by Add Property for the new one.


Property Pie Chart


Navigation: erwin Evolve 360 User Help Guide > Item Views >

Property Pie Chart


Property Pie Chart

Pie charts help to visualize proportions between attributes.

To create a Property Pie Chart View:

          1. Click on All Views in the editor and then click on  icon placed at the bottom of the list of views.

          2. As the Property Pie Chart works like an Object Type View which returns the context from a single source.

For an instance, a Column layout is chosen, and configure a List View in the first column.

          3. To add Property Pie Chart in the second column,

Click Add Content > Add New View > Select Property Pie Chart.

          4. To pass the context from the source,

Click on the title of the layout and then Configuration from the toolbar.

Click Column 2.


Click Context Source > Select Internal > Apply Changes.


          5. To configure the Property Pie Chart, click on Configuration from the toolbar or right-click on the view.

By default, the property is set with Name. Edit the property or click Add Property for the new one.

          6. The Preview of the configured Property Pie Chart is shown in the picture below.


Property Radar Chart


Navigation: erwin Evolve 360 User Help Guide > Item Views >

Property Radar Chart


Property Radar Chart

Property Radar Chart is useful for comparing multiple numeric attributes.

To create a Property Radar Chart View:

          1. Click on All Views in the editor and then click on  icon placed at the bottom of the list of views.

          2. As the Property Radar Chart works like an Object Type View which returns the context from a single source.

For an instance, a Column layout is chosen, and configure a List View in the first column.

          3. To add Property Radar Chart in the second column,

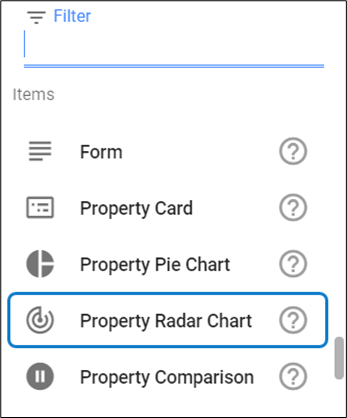
Click Add Content > Add New View > Select Property Radar Chart.
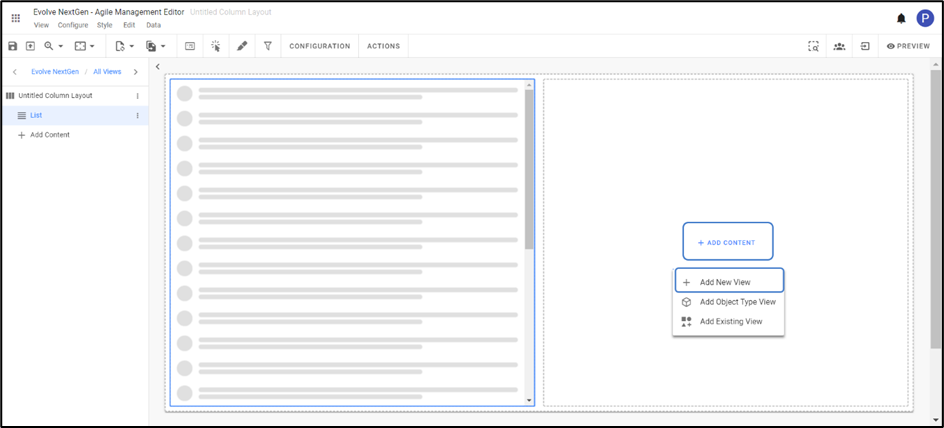
          4. To pass the context from the source,

Click on the title of the layout and then Configuration from the toolbar.

Click Column 2.
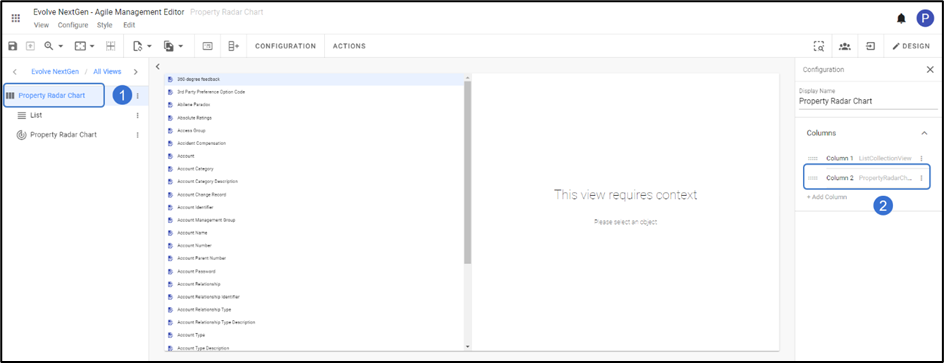
          

Click Context Source > Select Internal > Apply Changes.
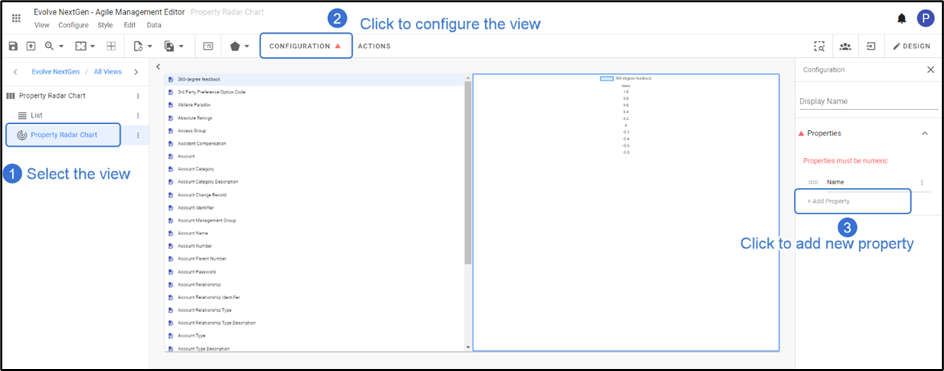
          5. Attributes need to be added to complete the view.

To configure the Property radar Chart, click on Configuration from the toolbar or right-click on the view.

By default, the property is set with Name. Edit the property or click Add Property for the new one.

          Note: Properties added must be numeric.
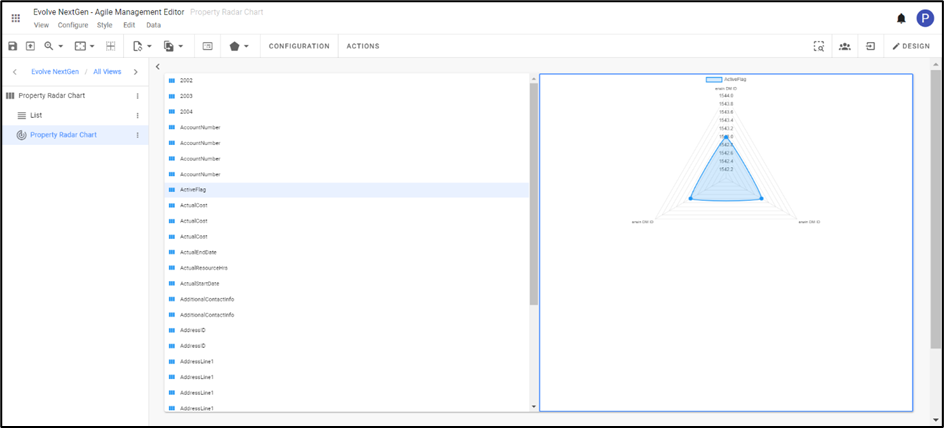
          6. The Preview of the Property Radar Chart with three defined properties.


Property Comparison


Navigation: erwin Evolve 360 User Help Guide > Item Views >

Property Comparison


Property Comparison

Property Comparison helps to compare two attributes or metrics in a card.

To create a Property Comparison View:

          1. Click on All Views in the editor and then click on  icon placed at the bottom of the list of views.

          2. As the Property Comparison works like an Object Type View, which returns the value of the two attributes in a single instance.

A Column layout is chosen for an instance and a List View in the first column.

          3. To add Property Comparison in the second column,

Click Add Content > Add New View > Select Property Comparison.

          4. To pass the context from the source,

Click on the title of the layout and then Configuration from the toolbar.

Click Column 2.


Click Context Source > Select Internal > Apply Changes.

          5. To configure the Count Comparison, click on Configuration on the toolbar or right-click on the view.

Select the Property for both Numerator and Denominator to see the compared attribute values.


Documentos relacionados

The document was helpful.

Selecione a classificação

I easily found the information I needed.

Selecione a classificação