|
Diagram View
Diagrams are two types, Manual and Auto diagrams.
Manual Diagrams are integrated with Diagrammer, where you can create associations to the model and edit the diagrams manually.
Auto Diagrams uses the same diagram types, but the diagrams are automatically drawn based on the data. They are dynamic, reads the data and generates the diagram through it.
How to configure Manual Diagrams
Manual Diagrams works as Object Type View, which requires a context from the source.
An example to configure Manual Diagram,
1.Click on All Views in the editor and then click on  icon placed at the bottom of the list of views. icon placed at the bottom of the list of views.
2.For instance, choose a Column Layout with a List in the Column 1.
Select Data Source as Diagram.
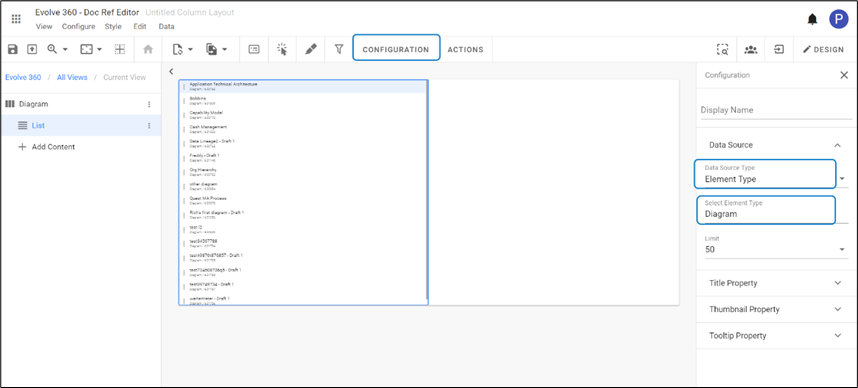
In column 2, select Object Type View
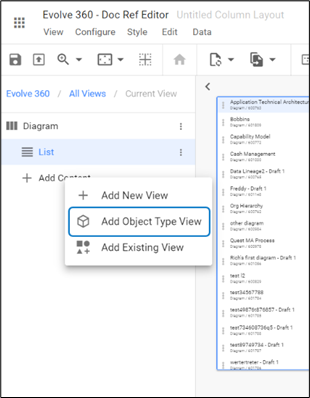
3. To pass the context from the source,
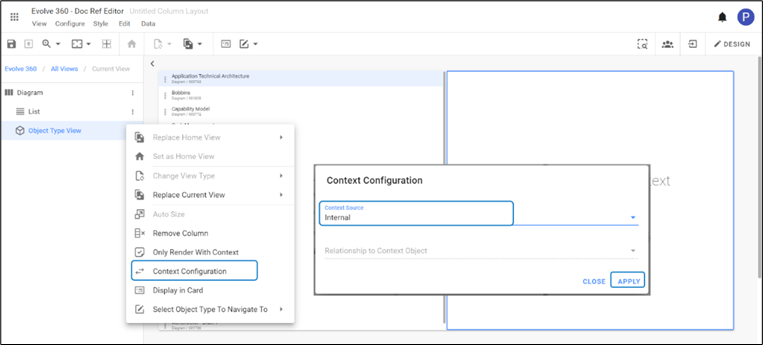
Click on three dots against the Object Type View from the left side then select Context Configuration. Or go to the columns list and then click on column 2.
Select Context Source > Internal > Apply.
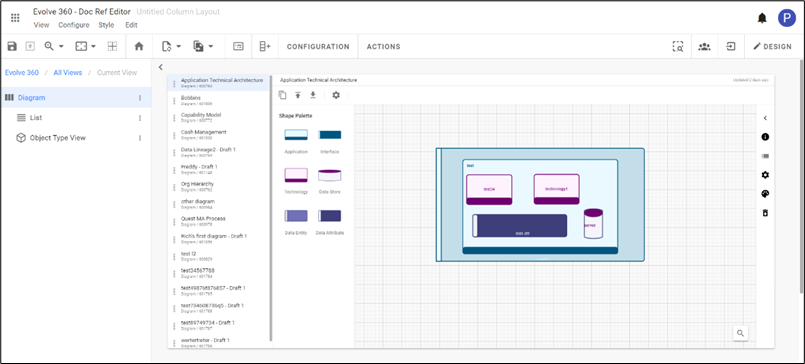
4. The Diagrams from the source will appear as shown in the picture below.
You can edit the diagrams to create association in the model. To edit, click on icon  from the top right corner. from the top right corner.
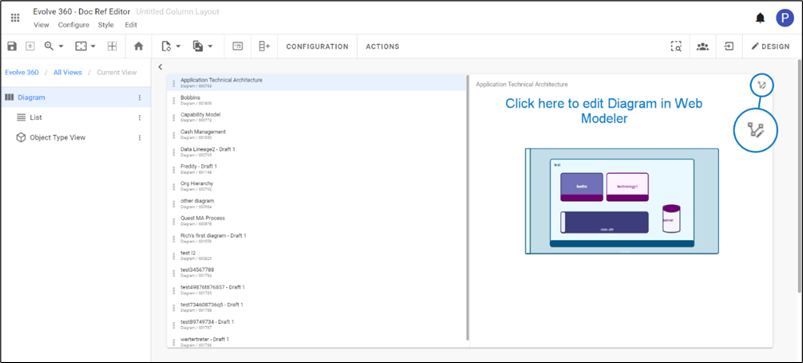
An editor called Diagrammer will be opened in the same space as shown in the picture below.
5. To create a new diagram to the list.
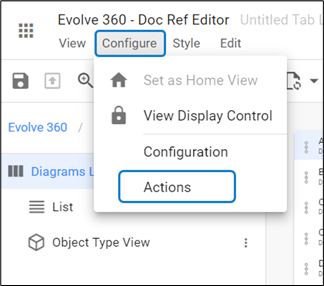
Go to Configure on toolbar, then select Actions.
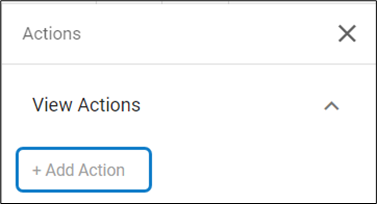
Click on +Add Action from the right-hand side. To edit, click on New Action created or click on three dots against it.
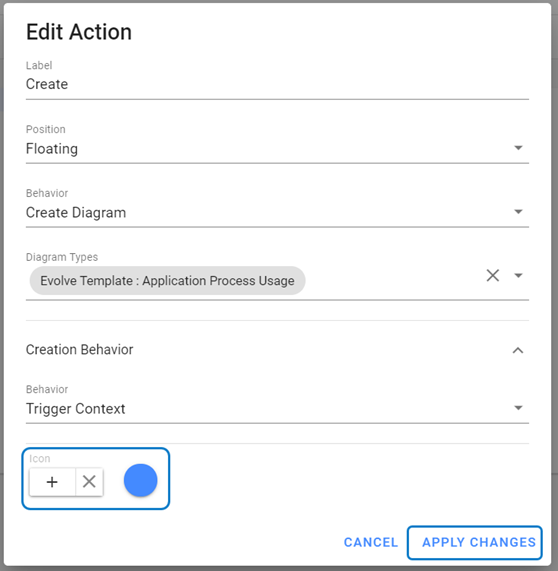
Enter Label > set Position > select Behavior of the action.
Choose Diagram Type and its Behavior
Select Icon and Color to the new action
Click on Apply Changes
|

|
Select Diagram Type is mandatory, such that you are defining a model by following that set of defined rules. |
|

|
Make sure you select Create Diagram instead of Create for the behavior of the action. |
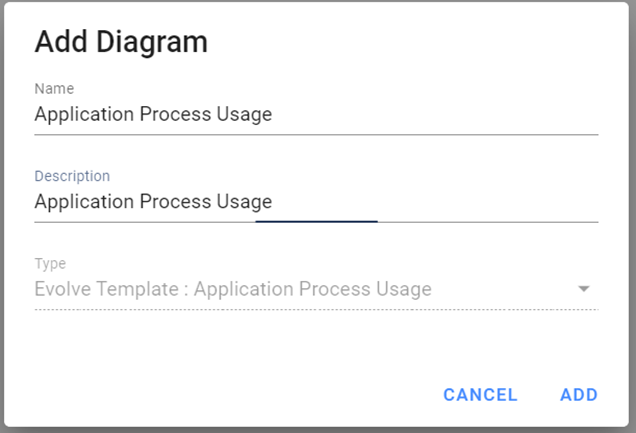
To add the new diagram to the list, click on  from the bottom of the column screen. from the bottom of the column screen.
Enter Name and Description of the new diagram, then click on Add.
|

|
Make sure you select Create Diagram instead of Create for the behavior of the action. |
Automated Diagrams
Automated Diagrams are the in-built diagram models, which reads the data from the source. These diagrams come along with the package or model.
Built in we have 3 layouts called Hierarchy, left to right & box in box.
These auto-diagrams require a diagram template and can be configured to make them look just right.
|