Chatee ahora con Soporte
Chat con el soporte

Foglight for Infrastructure 7.3.0 - Foglight for Web Monitor User and Reference Guide

Monitoring Web transactions Exploring your collection of monitored Web sites Investigating the performance of Web transactions and monitoring locations Exploring Web Monitor services Generating reports Configuring Web Monitor agent properties View reference
Web Monitor Performance Browser views Web Monitor Transaction Management views Web Monitor Service Operation Console and Foglight for APM Transactions views

Table 8. Top 5 Most Consumed Response Time view

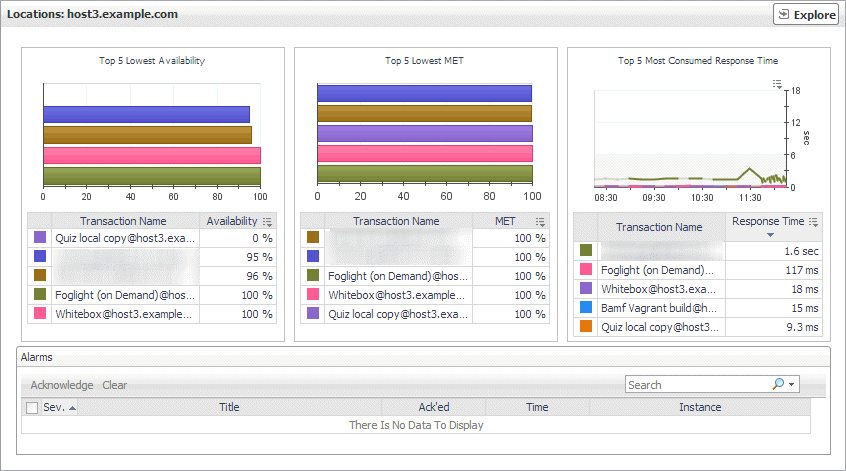
The Location view displays overall response and availability information for the transactions monitored from the selected location. It also identifies the transactions with the lowest availability, lowest MET (met expected time), and highest response time, showing the top five transactions in each of these categories. Use this view to identify the Web sites with degraded performance, and to perform further investigation.
2
In the Quick View, in the Locations view, select a location.
The Location view appears on the right.

This view is made up of the following embedded views:

Table 5. Alarms view

Lists the alarms generated against the selected location.

NOTE: To acknowledge or clear one or more alarms appearing in this table, select them and click Acknowledge or Clear, as required. For more information about alarms in Foglight, see the Foglight User Guide.
Ack’ed. Indicates if the alarm is acknowledged: true or false.
Instance. The name of the transaction against which the alarm is generated.
Severity. Indicates the alarm severity: Warning , Critical , or Fatal .
Time. The time at which the alarm is generated.
Title. The name of the rule that generated the alarm.

Drill down on:

Any row in this table. Displays the Alarm dialog box, showing additional information about the alarm. For more information about alarms in Foglight, see the Foglight User Help.

Shows the top five transactions with the lowest availability.

Availability. The percentage of times the Web site was available when the Web Monitor Agent attempted to collect information from it.
Transaction Name. The transaction name, associated with the monitored URL.

Drill down on:

Shows the top five transactions with the lowest MET.

MET. The percentage of times the Web site meets its acceptable time expected by the end user.
Transaction Name. The transaction name, associated with the monitored URL.

Drill down on:

Shows the top five transactions with the highest response time.

Response Time. The amount of time the Web site takes to respond to the Web Monitor Agent request.
Transaction Name. The transaction name, associated with the monitored URL.

Drill down on:

Locations view

The Locations view lists the hosts that are running instances of the Web Monitor Agent, and shows their states.
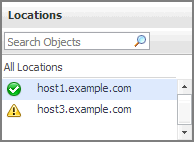
Selecting All Locations shows a list of all host names in the Summary - All Locations view on the right. Similarly, selecting a location in the list shows location-specific metrics in the Location view view on the right.

The Locations view appears in the Quick View on the left.
Alarm severity. The state of the most recent alarm raised against the associated location: Warning , Critical , or Fatal .
All Locations. A parent node for the location object instances that appear in this view.
Location. The name of the host on which the Web Monitor Agent is running.

Drill down on:

Location. Shows the Location view in the Quick View.

Table 9. Locations view

The Locations view lists the hosts that are running instances of the Web Monitor Agent, and shows their states.

Selecting All Locations shows a list of all host names in the Summary - All Locations view on the right. Similarly, selecting a location in the list shows location-specific metrics in the Location view view on the right.

The Locations view appears in the Quick View on the left.
Alarm severity. The state of the most recent alarm raised against the associated location: Warning , Critical , or Fatal .
All Locations. A parent node for the location object instances that appear in this view.
Location. The name of the host on which the Web Monitor Agent is running.

Drill down on:

Location. Shows the Location view in the Quick View.

Monitor tab

The Monitor tab is a container view. It displays a combination of location or transaction information, depending on your selection in the Web Monitor Environment view and the Quick View. Use it to understand the level of user experience offered by the monitored Web sites, and to investigate any issues that they may be experiencing.
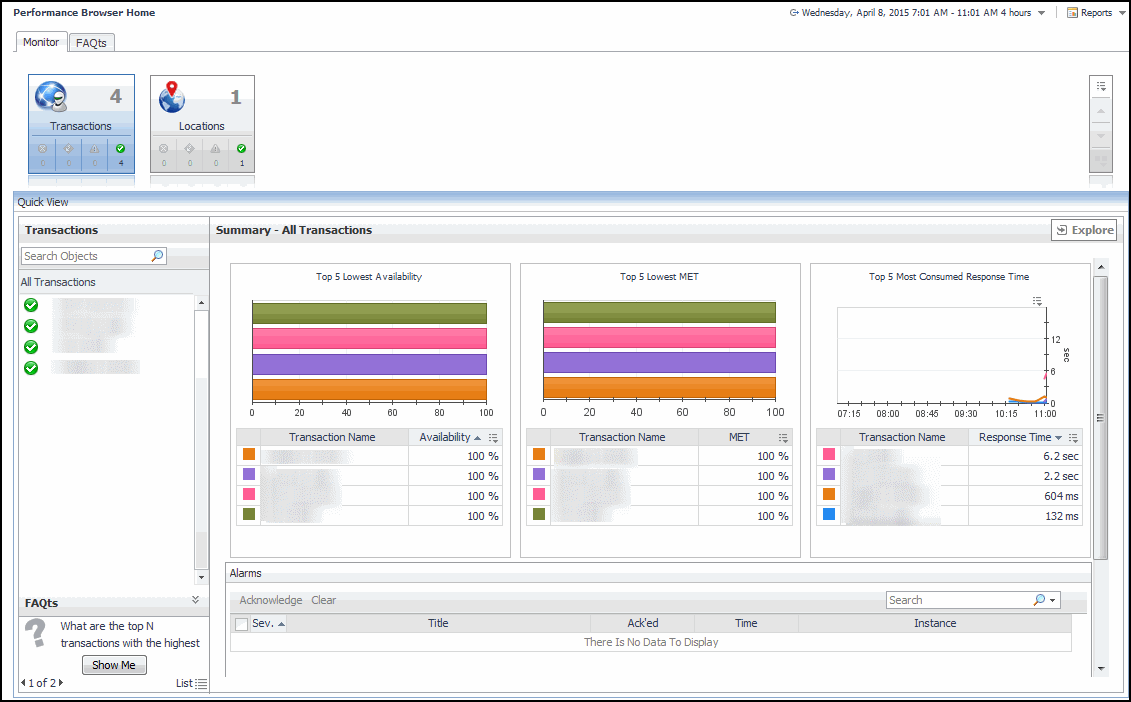
The Monitor tab appears open.

This view is made up of the following views:

Documentos relacionados

The document was helpful.

Seleccionar calificación

I easily found the information I needed.

Seleccionar calificación