Table 15. Top 5 Most Consumed Response Time view
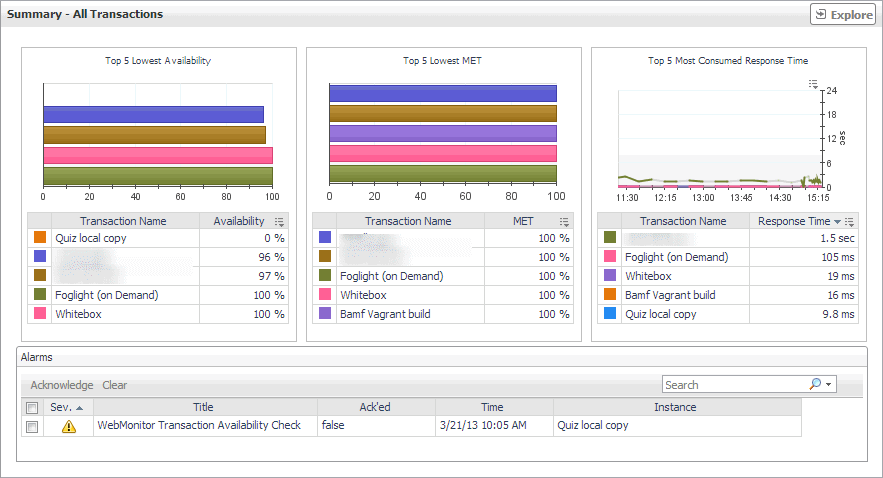
The Summary - All Transaction view displays overall response and availability information for the monitored transactions. It also identifies the transactions with the lowest availability, lowest MET (met expected time), and highest response time, showing the top five transactions in each of these categories.

The Summary - All Transactions view appears on the right.
This view is made up of the following embedded views:
Transaction at a Selected Location drilldown view
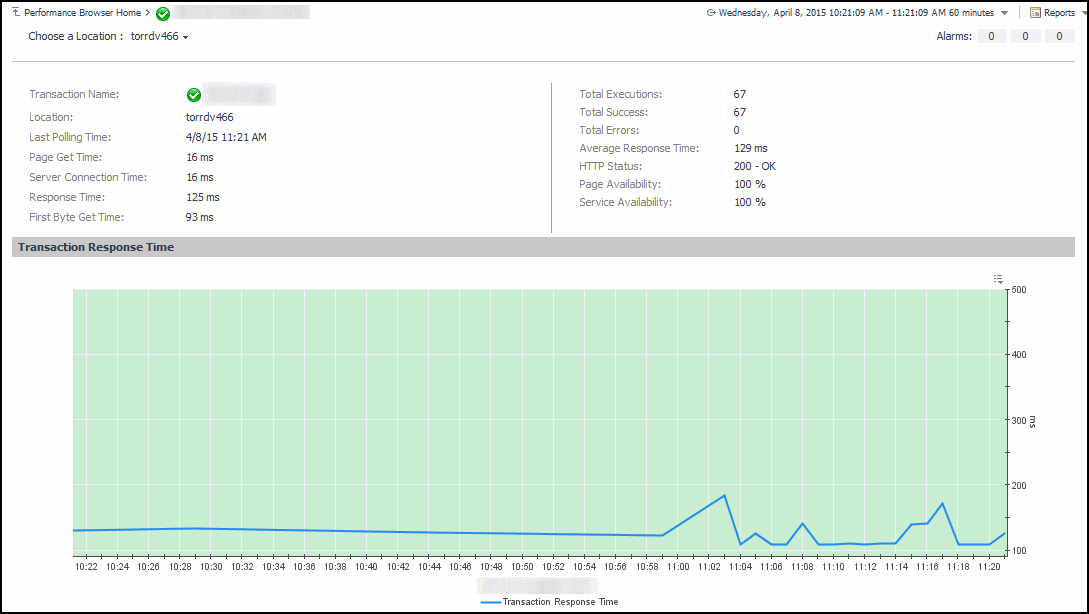
The Transaction at a Selected Location drilldown view provides details about the performance of a transaction monitored from a specific location. This view describe the overall state of the most recent monitoring attempt and response-times recorded during the selected time range, along with its overall health during the monitored time range. Use it to find out how well your Web sites are performing when being monitored from a specific location in your monitoring environment.

This view is made up of the following embedded views:
|
|
Displays details about the selected location. |
|
|
|
• |
Average Response Time. The average amount of time the Web Monitor Agent waits for a response from the monitored Web site. |
|
• |
First Byte Get Time. The time between the Web Monitor Agent detects the first byte of the response from the monitored Web site. |
|
• |
HTTP Status. The HTTP status code, indicating the result of the most recent transaction with the monitored Web site. |
|
• |
Location. The name of the host on which the Web Monitor Agent is running. |
|
• |
Page Availability. The percentage of time the Web site was available when the Web Monitor Agent attempted to collect information from it. |
|
• |
Page Get Time. The amount of time the agent needs to retrieve the data form the monitored Web site. |
|
• |
Response Time. The amount of time the Web Monitor Agent waits for a response from the monitored Web site. |
|
• |
Service Availability. The percentage of time the service was available when the Web Monitor Agent attempted to collect information about this Web site. |
|
• |
Total Errors. The total number of execution attempts that resulted in errors the Web Monitor Agent encountered during the selected time range. |
|
• |
Total Executions. The total number of execution attempts the Web Monitor Agent performed during the selected time range. |
|
• |
Total Executions. The total number of execution attempts the Web Monitor Agent performed during the selected time range. |
|
• |
Total Success. The total number of successful executions the Web Monitor Agent performed during the selected time range. |
|
|
|
Displays the transaction response times over the selected time range.
|
• |
Health History. A color-coded bar, representing the alarm state of the monitored location over the selected time range. The color of the bar changes depending on the alarm state. Red indicates a Fatal state, orange indicates Critical, yellow means Warning, and green is the Normal State. |
|
• |
Transaction Response Time. The amount of time the Web site takes to respond to the Web Monitor Agent request, over the selected time range period. High values in the graph can indicate potential bottlenecks that likely need to be investigated. | |
Table 16. Alarms view
The Transaction at a Selected Location drilldown view provides details about the performance of a transaction monitored from a specific location. This view describe the overall state of the most recent monitoring attempt and response-times recorded during the selected time range, along with its overall health during the monitored time range. Use it to find out how well your Web sites are performing when being monitored from a specific location in your monitoring environment.

This view is made up of the following embedded views:
|
|
Displays details about the selected location. |
|
|
|
• |
Average Response Time. The average amount of time the Web Monitor Agent waits for a response from the monitored Web site. |
|
• |
First Byte Get Time. The time between the Web Monitor Agent detects the first byte of the response from the monitored Web site. |
|
• |
HTTP Status. The HTTP status code, indicating the result of the most recent transaction with the monitored Web site. |
|
• |
Location. The name of the host on which the Web Monitor Agent is running. |
|
• |
Page Availability. The percentage of time the Web site was available when the Web Monitor Agent attempted to collect information from it. |
|
• |
Page Get Time. The amount of time the agent needs to retrieve the data form the monitored Web site. |
|
• |
Response Time. The amount of time the Web Monitor Agent waits for a response from the monitored Web site. |
|
• |
Service Availability. The percentage of time the service was available when the Web Monitor Agent attempted to collect information about this Web site. |
|
• |
Total Errors. The total number of execution attempts that resulted in errors the Web Monitor Agent encountered during the selected time range. |
|
• |
Total Executions. The total number of execution attempts the Web Monitor Agent performed during the selected time range. |
|
• |
Total Executions. The total number of execution attempts the Web Monitor Agent performed during the selected time range. |
|
• |
Total Success. The total number of successful executions the Web Monitor Agent performed during the selected time range. |
|
|
|
Displays the transaction response times over the selected time range.
|
• |
Health History. A color-coded bar, representing the alarm state of the monitored location over the selected time range. The color of the bar changes depending on the alarm state. Red indicates a Fatal state, orange indicates Critical, yellow means Warning, and green is the Normal State. |
|
• |
Transaction Response Time. The amount of time the Web site takes to respond to the Web Monitor Agent request, over the selected time range period. High values in the graph can indicate potential bottlenecks that likely need to be investigated. | |
Table 17. Location view
The Transaction at a Selected Location drilldown view provides details about the performance of a transaction monitored from a specific location. This view describe the overall state of the most recent monitoring attempt and response-times recorded during the selected time range, along with its overall health during the monitored time range. Use it to find out how well your Web sites are performing when being monitored from a specific location in your monitoring environment.

This view is made up of the following embedded views:
|
|
Displays details about the selected location. |
|
|
|
• |
Average Response Time. The average amount of time the Web Monitor Agent waits for a response from the monitored Web site. |
|
• |
First Byte Get Time. The time between the Web Monitor Agent detects the first byte of the response from the monitored Web site. |
|
• |
HTTP Status. The HTTP status code, indicating the result of the most recent transaction with the monitored Web site. |
|
• |
Location. The name of the host on which the Web Monitor Agent is running. |
|
• |
Page Availability. The percentage of time the Web site was available when the Web Monitor Agent attempted to collect information from it. |
|
• |
Page Get Time. The amount of time the agent needs to retrieve the data form the monitored Web site. |
|
• |
Response Time. The amount of time the Web Monitor Agent waits for a response from the monitored Web site. |
|
• |
Service Availability. The percentage of time the service was available when the Web Monitor Agent attempted to collect information about this Web site. |
|
• |
Total Errors. The total number of execution attempts that resulted in errors the Web Monitor Agent encountered during the selected time range. |
|
• |
Total Executions. The total number of execution attempts the Web Monitor Agent performed during the selected time range. |
|
• |
Total Executions. The total number of execution attempts the Web Monitor Agent performed during the selected time range. |
|
• |
Total Success. The total number of successful executions the Web Monitor Agent performed during the selected time range. |
|
|
|
Displays the transaction response times over the selected time range.
|
• |
Health History. A color-coded bar, representing the alarm state of the monitored location over the selected time range. The color of the bar changes depending on the alarm state. Red indicates a Fatal state, orange indicates Critical, yellow means Warning, and green is the Normal State. |
|
• |
Transaction Response Time. The amount of time the Web site takes to respond to the Web Monitor Agent request, over the selected time range period. High values in the graph can indicate potential bottlenecks that likely need to be investigated. | |