Viewing, Acknowledging, and Clearing Alarms
Alarms are triggered when problems arise in your monitored environment. Foglight fires alarms when a rule determines that certain pre-defined conditions are met.
Use the Alarms dashboard to view the state of alarms across your monitored environment and take immediate action on them. The Alarms dashboard shows alarm counts by time, allowing you to identify excessive alarm counts or outage events.
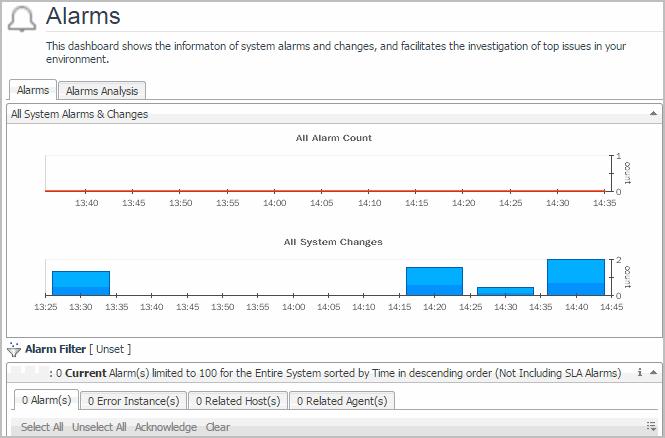
The Alarms dashboard shows the information of system alarms and changes, and facilitates the investigation of top issues in your environment. The Alarms dashboard includes the following elements:
After accessing the Alarms dashboard, the All System Alarms & Changes view appears at the top of the Alarms dashboard by default. This view contains charts that summarize the alarm and change activity for the current time range. For information about changing or freezing the time range, see Time Range. Hover over a line or bar in a chart to cause a tooltip to appear that lists the number of alarms or changes that occurred nearest to that time. The alarm count in this view includes SLA (Service Level Agreement) alarms.
The Alarm Analysis view is to provide a snapshot of alarms and to help you investigate top issues in your environment, so you can more proactively manage your alerts, thresholds, and monitored system. The alram count in this view includes SLA alarms.
The maximum number of alarms for the selected time range is set to 5000 by default. To change this value, type the number in the Max Number of Evaluated Alarms field, and then click Apply. The Max Number of Evaluated Alarms is scaled from 0 to 100,000 and is managed by the Alarm_Analysis_Max_Object variable. To change the value of this variable, search for and edit Alarm_Analysis_Max_Object from Dashboards > Administration > Rules & Notifications > Manage Registry Variables.
The Alarms Analysis (Preview) view contains the following elements:
|
• |
Alarms by Source: Lists all alarms (cleared or non-cleared) that are triggered by the alarm source. For more information about alarm sources, click Dashboards > Administration > Rules & Notifications > Rules. |
|
• |
Counts by Severity chart: Summarizes the totals for each severity of alarm (Warning, Critical, or Fatal) and the total number of alarms. |
|
• |
Alarms by Service: Summarizes the total alarms and agents that are not included in services, as well as all alarms (cleared or non-cleared) that are triggered by services. For more information about services, click Dashboards > Services > Service Builder. |
At the bottom of the Alarms dashboard, the view lists up to 5000 alarms for the current or historical time range. It does not list SLA alarms. You can filter the list, sort it by column, or acknowledge and clear alarms.
The alarms list also shows cleared alarms and indicates whether an alarm has been acknowledged or cleared. Cleared alarms appear dimmed and can be filtered out using the Alarm Filter dialog box. To access the Alarm Filter dialog box, click Alarm Filter in the top-left corner of the list.
To see more detailed information about an alarm, hover over or click a column to display a dwell or a popup. You can select an alarm and investigate, acknowledge, or clear it.
The alarm list view allows you to select different perspectives on alarms. This chapter discusses using the Alarm(s) tab. For information about using the other tabs, see Alarm List.
Viewing Alarms
This topic discusses viewing alarms in more detail.
You can filter the list according to different criteria by clicking 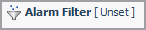 in the top-left corner of the list and changing the settings in the Alarm Filter dialog box.
For example, you can filter the list of alarms to show only Current or Historical alarms. Select Current to shows all outstanding alarms. This is essentially the current outstanding set of alarms that need to be addressed. Use Current if you want to see what is immediately noteworthy. In contrast to Current, Historical shows all alarms that fired during a certain interval, regardless of whether they are active or cleared. Use Historical if you want to see what is happening in your monitored environment during a specific time range.
In the Alarm Filter dialog box, you can also set a number of other parameters to help you filter the list, and you can set the maximum number of results to display in the table.
To view details about an alarm, click its severity icon in the Alarm(s) list. Information about that alarm is displayed in the Alarm Details dialog box. Depending on how a rule is set up, the Alarms Details view varies. If the rule is set up with no associations to its Rule ID, the following view is displayed:
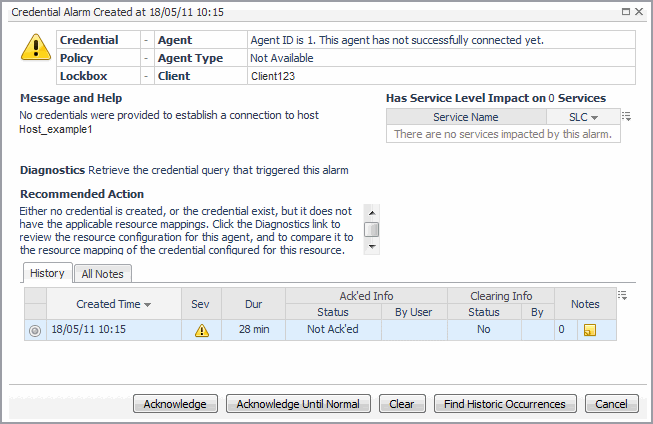
This dialog box shows the alarm’s service level impact and its full history. The history includes all consecutive alarms fired by the same rule on the same object (instance) regardless of the dashboard’s time range.
In addition, this dialog box displays a diagnostics and a recommended action message to assist you in resolving the problem. Click one of the provided links to display a drilldown page that will assist you in diagnosing the problem. For example, if an alarm is fired because the credentials were not established when trying to connect to a host machine, drilldown links to credential details are provided. Click the Diagnostics link to display the Credentials Query dialog box. From there, you can configure the credential query that triggered the alarm. Click the Recommended Action link to display the Manage Credential dashboard. From there you can map each credential to one or more resources, choosing the parameters and patterning criteria that best suit your needs.
The Alarm Details dialog box also illustrates how the alarm has changed in the current alarm chain. See Alarm Chaining.
You can also drill down from this dialog box to investigate the severity of the alarm in more detail. For example, click the icon in the Service Level Impact table for information about the service whose Service Level Agreement is affected by the alarm. Performing impact analysis on an alarm helps you to determine the priority of the problem that caused the alarm to fire.
If an alarm has an association set up and is triggered by a rule, the following dialog box appears:
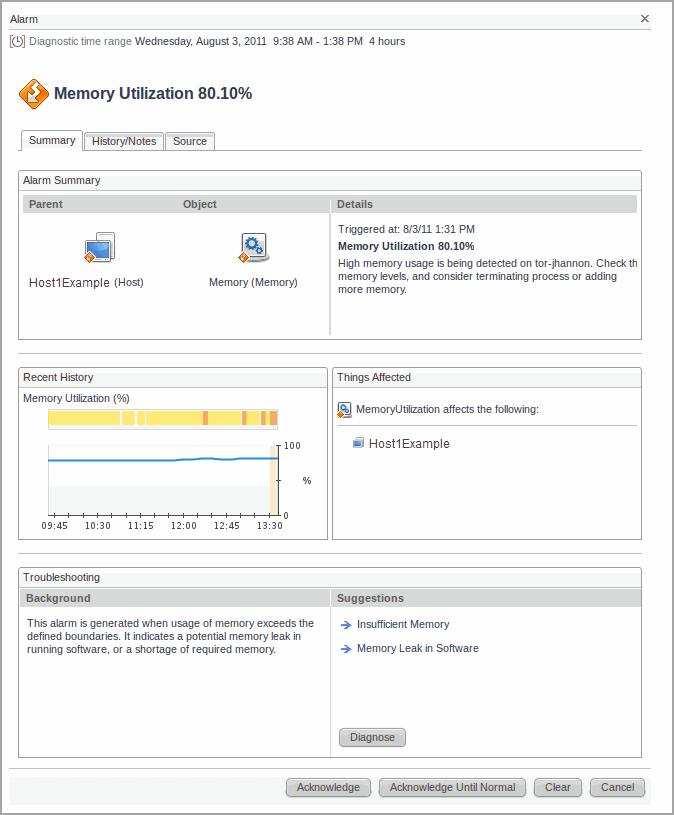
This dialog box shows the summary, history, and source information to assist you in diagnosing the cause of an alarm. From here you can identify the objects (instances) affected, and review the suggested causes and potential solutions. The Diagnose button appears if the rule diagnosis property is set in the rule and the user has the appropriate role to access the Diagnose view. Click the Diagnose button to review the resource configuration for the alarm. The History/Notes tab displays the recent history and associated notes for that alarm. The Source tab displays details about the agent that collected the data and the associated rule. Users with the Administrator role can edit the associated rule. For more information about creating and editing rules, see the Administration and Configuration Guide.
In the Alarms table, the Instance field lists the object in your monitored environment that is the source of the alarm. Click the listing for an alarm source to display its health summary. The health summary shows the number of alarms by severity and the health of the alarm source and lists the agents and host associated with the alarm source.
In addition, it provides a list of related views that show quick drilldowns to help identify the root cause. This list is based on the views that match the type of the alarm source. If no related views are available, then the default views (for example, Configuration > Data browser) are provided.
Using alarm notes is a handy way to record information about an alarm for other users to view. For example, if an urgent alarm comes up that you want to investigate, you can add a note to the alarm that you are checking if a certain process is causing the problem. The note is attached to the alarm along with your user name and a timestamp.
You can view, filter, add, and edit alarm notes from the Alarm Details dialog box. Use the History tab to attach notes to a particular alarm in the history table. Use the All Notes tab to attach a note to the most recent alarm in the alarm history. For more information, Alarm Notes.
Acknowledging an Alarm
The Ack’ed column displays No for any alarms that have not been acknowledged. Once an alarm has been acknowledged, this setting cannot be changed.
If you have the Advanced Operator role, you can acknowledge alarms. To acknowledge multiple alarms at once, follow the instructions in To acknowledge one or more alarms: . To cause alarms to remain acknowledged until the monitored object returns to a normal state, follow the instructions in To acknowledge an alarm until the alarm source returns to a normal state: .
To acknowledge one or more alarms:
|
3 |
Click Acknowledge at the top of the table. |
|
3 |
Click Acknowledge Until Normal. |
Clearing an Alarm
In most cases, Quest Foglight clears an alarm when the condition or conditions that triggered the alarm changes. For example, an alarm fires when the CPU usage metric for a monitored host exceeds a certain threshold. If the value of the metric drops below this threshold, Quest Foglight clears the original alarm. If the alarm condition occurs again, the alarm reappears.
If you have the Advanced Operator role, you can also manually clear alarms. However, you should only do so when alarms do not clear themselves—for example, for log messages or one-time events that generate alarms.
The Cleared column in the Alarm(s) list indicates whether an alarm has been cleared or not. In addition, cleared alarms appear dimmed.
|
3 |
Click Clear at the top of the table. |
Alternatively, you can clear an alarm from the Alarms details dialog box. It appears dimmed in the dialog box when you have done so. If you are filtering the Alarm(s) list to show current alarms, the alarm is also removed from the list.
