
Online-Only Topics
You can also use the Manage Reports dashboard to quickly generate and schedule new reports using an existing set of reports. From this dashboard you can run a report (see Online-Only Topics) and you can filter which reports are displayed in the table by selecting a template, module, or role.
|
TIP: Show or hide columns in the views using the dialog box that appears when you click the Customizer icon ( |
|
1 |
|
2 |
Click Manage Reports. |
|
3 |
Click Currently Showing all Reports. |
|
4 |
Clear the Show All Reports check box. |
The reports that Quest Foglight has generated appear in the Generated Reports view. Use this view to download generated reports and to see details about a report such as its name, format, and the date on which it was generated. Report details are listed in the table and in the popup that appears when you click the row for a report.

|
2 |
|
2 |
|
1 |
|
2 |
Click Manage Reports. |
|
4 |
Click Schedule. |
|
a |
In the Name field, type a unique name for the report. |
|
b |
Choose the Output Format: |
|
• |
PDF is the default option. |
|
• |
Excel creates a report that you can open in Microsoft Excel. |
|
• |
XML creates a report in the XML format. Select this format if you want to import the data into other applications. |
|
c |
In the Retain field, type the number of instances of a scheduled report that you want Quest Foglight to keep. For example, if you type 3, Quest Foglight deletes the oldest instance of this report when it generates a fourth instance. |
|
d |
The Enable Scheduling check box is selected by default. When this option is selected, the scheduled report is automatically enabled when you click Finish. |
|
e |
Optional—type a comma-separated list of the email addresses of the recipients to whom you want Quest Foglight to email this report. |
|
f |
Click Next. |
|
6 |
|
b |
To specify a value, click the Edit icon ( |
|
c |
Click Next. |
|
a |
Select the schedule that determines when Quest Foglight runs the report. For example, choose End of day to run the report daily, at the end of each day (5:00 pm by default). Select a schedule from the list or click the Add icon |
|
TIP: If you have a long list of schedules, use the Search field to narrow it down. Start typing the schedule name into the Search field. You can also click the Search menu to perform an advanced search or use regular expressions. |
|
b |
Click Next. |
|
8 |
Confirm if the report values are correct. If they are not, click Previous and make the appropriate changes. If they are correct, click Finish to save your scheduled report. |
|
2 |
|
3 |
Supply the values for the report input parameters. In the Optional or Required fields, click the Edit icon |
|
a |
In the Name field, type a unique name for the report. |
|
b |
Choose the Output Format: |
|
• |
PDF is the default option. |
|
• |
Excel creates a report that you can open in Microsoft Excel. |
|
• |
XML creates a report in the XML format. Select this format if you want to import the data into other applications. |
|
c |
Optional—if you want Quest Foglight to send this report to specific individuals, type a comma-separated list of email addresses of the required report recipients. |
|
d |
Click Next. |
|
5 |
Confirm if the report values are correct. If they are not, click Previous and make the appropriate changes. If they are correct, click Finish to generate your report. |
Use the Scheduled Reports table to:
|
• |
|
• |
|
• |
You can select a previous scheduled report to view or download it.
|
2 |
In the Generated From Scheduled Report table, click a generated report in the Date column and click View to start the process of saving or opening the report. |
|
2 |
Click Delete. |
|
3 |
Optional — In the confirmation dialog, select the Delete related Generated Reports check box if you want to delete generated instances of this scheduled report. Once selected, click Delete. |
You can change these settings at any time from the Scheduled Reports view.
|
2 |
Click |
|
3 |
You can create a new scheduled report by copying or editing an existing scheduled report.
|
1 |
|
2 |
Click Manage Reports. |
|
a |
In the Name field, type a unique name for the report. |
|
b |
Choose the Output Format: |
|
• |
PDF is the default option. |
|
• |
Excel creates a report that you can open in Microsoft Excel. |
|
• |
XML creates a report in the XML format. Select this format if you want to import the data into other applications. |
|
c |
In the Retain field, type the number of instances of a scheduled report that you want Quest Foglight to keep. For example, if you type 3, Quest Foglight deletes the oldest instance of this report when it generates a fourth instance. |
|
d |
The Enable Scheduling check box is selected by default. When this option is selected, the scheduled report is automatically enabled when you click Finish. |
|
e |
Optional—type a comma-separated list of the email addresses of the recipients to whom you want Quest Foglight to email this report. |
|
f |
Click Next. |
|
5 |
|
b |
To specify a value, click the Edit icon ( |
|
c |
Click Next. |
|
a |
Select the schedule that determines when Quest Foglight runs the report. For example, choose End of day to run the report daily, at the end of each day (5:00 pm by default). Select a schedule from the list or click the add icon |
|
TIP: If you have a long list of schedules, filter the list of templates by typing the first few letters of the template name or module in the Search field. You can also click the Search menu to perform an advanced or regular expression search. |
|
b |
Click Next. |
|
7 |
Confirm if the report values are correct. If they are not, click Previous and make the appropriate changes. If they are correct, click Finish to save your scheduled report. |
Online-Only Topics
You can also create a filter to display only certain groups of hosts. See Monitoring Remote System Agents for more information.
|
TIP: Visit http://eDocs.quest.com to watch our learning videos. See introduction to Managing Agents. |
|
• |
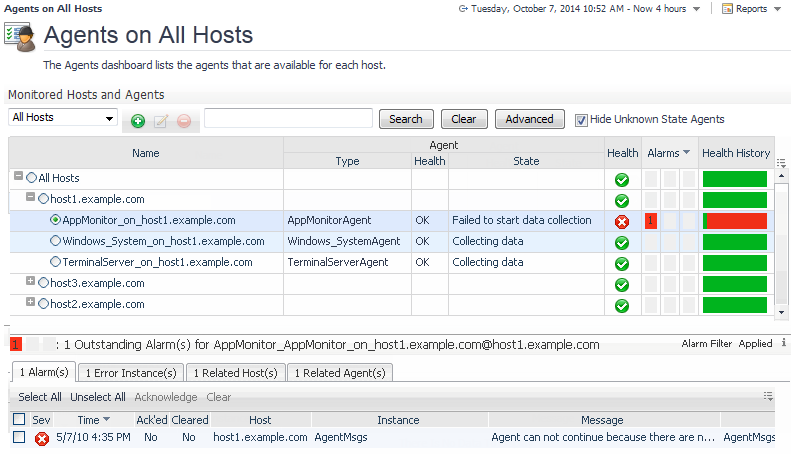
You can filter the hosts by clicking Agent Filter in the Action panel to open the Agent Filter dialog box.
|
1 |
Click the Health History bar for the appropriate host from one of the following dashboards: |
|
• |
From the Agents on all Hosts dashboard (on the navigation panel, under Homes, click Agents) |
|
• |
|
NOTE: By default, the Health History column in the Hosts dashboard is hidden. To view it, click the Show/Hide icon |

|
1 |
|
2 |
Optional — On the Agents on all Hosts dashboard, use the filter at the top of the dashboard to search for a specific hosts or agents. The hosts found will be added to your group. |
|
• |
A unique Name for the service. |
|
• |
|
5 |
Click Create. |
Editing a group of monitored agents takes you to the Service Builder dashboard.
|
1 |
|
6 |
Optional — Click the |
|
7 |
Optional — Select the domain to add. |
|
8 |
Click Finish. |
|
1 |
|
4 |
Click Confirm. |
Online-Only Topics
For more information, see the following topics:
|
1 |
When you create a service, you add different elements that compose its structure:
|
• |
A category, which is a top-level service. For example, a department or application set. See Adding a new category for instructions on how to add a category. |
|
• |
Other services contained within the category. For example, a team within the department or one application in the set. See Creating a Service Contained by Another Service for instructions on how to create a service. |
|
• |
You classify the services you create as a global (common) service or a local (custom) service.
For example, create a service called Accounting to monitor the performance of an accounting system. This accounting system has a web front-end for data entry and uses a Weblogic server and a SQL server in the back-end. The data collected on the end user response time, the Weblogic server, and the SQL server are added to this service as three separate components. By selecting Let Foglight Decide as the Tier, these components are assigned to their default tiers in the Service Operations Console. Also, by setting Select components used to determine the availability of this service to Only components in selected tiers and selecting only the User tier, only the end user response time (for example, time spent posting transactions using the web interface) is used to determine the availability of this service. This is reflected in the Service Level Compliance column in the Service Operations Console dashboard.
|
1 |
On the Service Builder dashboard, click Add A New Category. |
|
2 |
Type a Name for the category. |
|
3 |
Optional — Enter text in the Short Description and Description fields. The text in the Description field appears in a dwell when you hover over a service. |
|
4 |
Select a Tier. You can keep the default selection “Let Quest Foglight Decide” or optionally assign this service to a tier. Selecting a specific tier causes all objects in this service to be grouped under that tier. The results are displayed in the Service Operations Console. |
|
5 |
From the Drilldown menu, you can specify a view to drill into from this service. Click Is not configured and select the view that Quest Foglight will use as the drilldown view from this service. If you have created a shared custom dashboard, this dashboard can be used as a drilldown view for this service. It also appears in the drilldown list under your user name and is available to other users with the same role permissions. In the example drilldown list below, the user test_user has the ability to set the custom dashboard called Test-dashboard as the drilldown view for this service. |


|
6 |
Optional — From the Quest Foglight can automatically add hosts that support any object you add to your service option, you can disable this setting. By default it is enabled to dynamically add and maintain hosts in this service. Click No to disable this option. |
|
7 |
Optional — Set the Objects used to determine the availability of this service option. These selected tiers will be used to evaluate the Service Level Agreement (SLA). Select one of the following options: |
|
• |
All components added to this service. This is the default option. |
|
• |
Only components in selected tiers. Select this option to specify the individual tiers that you want to include. Click the check box beside the tier name to include it. |
|
8 |
Click Next. |
|
9 |
Optional — Select the domains to associate with this service category. |
|
NOTE: Descriptions for the Domains are display if the Cartridge for Infrastructure is installed. Domains with no activity are not displayed in the Cartridge for Infrastructure until an activity is detected. For more information about the Infrastructure dashboard, see the Managing the Infrastructure Cartridge User and Reference Guide. |
|
10 |
Click Finish. The new top-level service is added to the Service Builder table. |
You can specify the service components to monitor.
|
1 |
Under the Actions column, click |
|
2 |
From the dialog box, click Add components to this service. |
|
3 |
Click Add specific component. |
|
a |
In the Name Containing field, type a search string. |
|
b |
|
• |
|
• |
|
• |
|
c |
Optional — Create your own object group by clicking View Object Groups. See Creating Custom Object Groups. |
|
d |
In the Object(s) found table at the bottom of the dialog box, select the specific components you want to add to your Object group. Click Select All to quickly select components listed on the table. Click Unselect All to clear the selection. To locate a component by name and type, click Advanced. You can also use regular expressions. |
|
5 |
Click Add Components. |
|
1 |
|
2 |
In the Objects groups dialog box, click |
|
3 |
Ensure the Is Disabled check box is cleared to enable the object group activation. |
|
4 |
Click Create. |
|
5 |
|
6 |
In the Name field, type a unique name for the subgroup. In this example, type Example. |
|
7 |
|
8 |
Optional—click Test to review the results. |
|
9 |
Click Create. |

|
1 |
In the Service Builder dashboard, expand the service hierarchy and click |
|
2 |
In the dialog box, click Create a child service. |
|
• |
New Local Service—creates a new local service and automatically attaches it to the selected service. As a local service, it is not listed in the Global Services and cannot be reused in different services. |
|
• |
New Global Service—creates a new global service and automatically attaches the service to the selected service. A global service is designed to be reused in other services in the service model. Once added, it will be listed as one of the existing global services from which you can select. |

|
4 |
Type a Name for the category. |
|
5 |
Optional—enter text in the Short Description and Description fields. The text in the Description field appears in a dwell when you hover over a service. |
|
6 |
Select a Tier. You can keep the default selection “Let Quest Foglight Decide” or optionally assign this service to a tier. |
|
7 |
From the Drilldown you can select a view to drill into from this service using the service dialog box. Click Is not configured and select the view that is going to be used as the drilldown of this service. |
|
8 |
In the Yes/No field, indicate whether or not the hosts of the components added to the service should be included automatically as part of the service. By default, Quest Foglight automatically adds the hosts that support any object you add to this service. If you want Quest Foglight to dynamically add and maintain the hosts for this service, click Yes. Otherwise, if you prefer to manage hosts manually, click No. You can add hosts manually by using the Add Specific Components dialog box of the Service Builder. For more information, see Adding Service Components. |
|
9 |
Click Create. |
|
10 |
Now you are ready to add components to your newly created child service. Click |
|
• |
Add components to this service—select components such as hosts, servers, databases, or other services from the list of existing components. See Adding Service Components. |
|
• |
Create a child service—such as a new global or local service. See Creating a Service Contained by Another Service. |
A service can contain many rule-based groups.
|
1 |
In the Service Builder dashboard, expand the hierarchy and click |
|
2 |
On the dialog box, click Add components to this service and then click Create a rule to add a group of components. Quest Foglight can auotmatically adds the hosts that support any object you add to a service. |

|
4 |
Type a Name for the rule. |
|
5 |
Choose a scope on which to run the query. For example, if you want to choose from a set of hosts, select Hosts > All Hosts to execute a query on the hosts. |
|
7 |
Click Test and confirm that the objects are found in the query result. |

|
8 |
Click Create. At this point you should see a new rule-based group of components appear under the service that is associated with one host. |
By clicking the Edit button on the Service Builder dashboard, you can:
|
1 |
|
2 |
|
3 |
Optional—rename your service. |
|
4 |
Optional—type a description, select a tier, or configure a drilldown, and if you do not want Quest Foglight to dynamically include the hosts to be added to the service select the No option button. |
|
5 |
Click Next. |
|
6 |
Click the |
|
7 |
Click Create. |

|
8 |
Click Next. |
|
10 |
Click Finish. |
You can remove a service, category, or a monitored component from its related service.
|
1 |
From the Service Builder dashboard, click Remove |
|
3 |
If you want to remove monitored components, you are prompted to select the components that you want to remove. Use Select All or Unselect All to quickly choose the components. |
|
5 |
Click Confirm to continue. |
|
1 |
On the Service Builder dashboard, click Email |
|
3 |
Optional—click Test to send a test email to the addresses in the list. |
|
4 |
Click Save. |
By specifying an alarm filter, you can decide what alarms impact the availability of a service.
|
1 |
|
3 |
From the Action panel on the right, click Service Builder. |
|
4 |
|
• |
By Rule—select the By Rule check box and choose a rule for which its alarms are to be included or excluded. You can define more than one alarm filter for the same rule. |
|
• |
Alarms—select the types of alarms to include or exclude. |
|
• |
Groovy Script—refine the filtering by running an optional groovy script. The current alarm is the only parameter passed to this script, meaning you can filter on anything that is referenced by the alarm. An example of a groovy script is: @alarm.get('topologyObject').getType().getName() == 'Windows_System_System_Table' |
|
7 |
Click Create. |
|
1 |
Online-Only Topics
|
1 |
|
2 |
Choose a Service Level Agreement by clicking Service Level Selector in the action panel. |
