Chat now with support
Chat with Support

Foglight for OpenStack 5.7.4 - User Guide

Using Foglight for OpenStack Interacting with Foglight for OpenStack dashboards Reference

Alarms Overview

The Alarms Overview groups the OpenStack alarms by object type and severity level. For monitoring alarms, use it as a starting point to quickly identify the sources of problems within the OpenStack infrastructure.

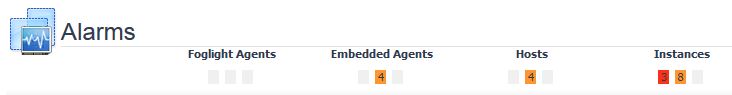
This view appears at the top of the OpenStack Alarms dashboard, preceding the Alarms List view.

Figure 35. Alarms Overview

The alarm counts are the total number of alarms for each alarm type: Normal, Warning, Critical, and Fatal. You can drill down on any alarm count by clicking it. The Alarms dialog box appears with a list of all related alarms.

Alarms List view

The Alarms List view shows all alarms fired in your OpenStack environment. For each alarm entry, the list shows the severity, the time the alarm was fired, the rule name that triggered the alarm, and the alarm message.

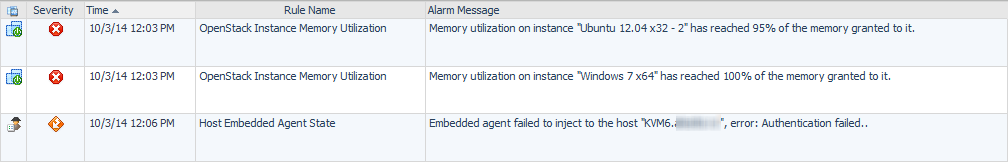
The Alarms List view appears on the OpenStack Alarms dashboard, just below the Alarms Overview.

Figure 36. Alarms List view

Object indicator

Indicates which object type the alarm is related to.

Severity

Indicates the alarm severity: Warning, Critical, or Fatal.

Time

The time at which the alarm was generated.

Rule Name

The name of the rule that triggered the alarm.

Alarm Message

An explanation about why the alarm occurred.

Clicking an alarm’s Severity, Rule Name, or Alarm Message displays the Alarm Created dialog box, showing additional information about the alarm.

Clicking an alarm’s object indicator takes you to summary information for that particular resource object.

OpenStack Explorer Dashboard View

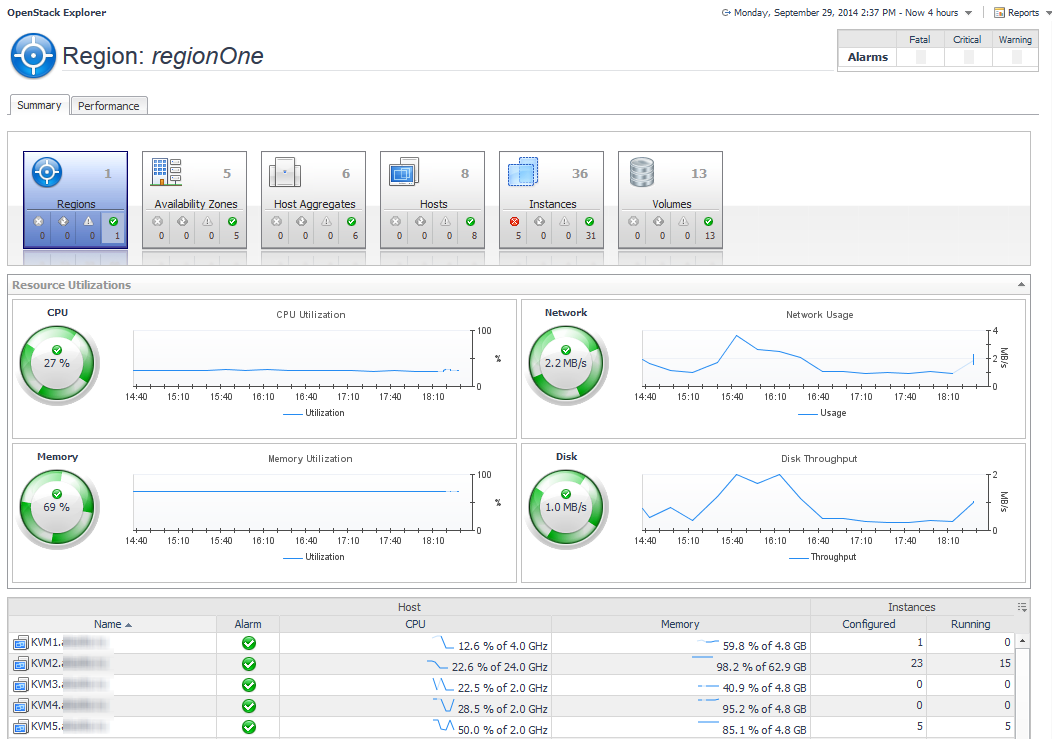
The OpenStack Explorer dashboard view takes up the entire display panel of the browser interface. For more information about the OpenStack Explorer dashboard, see Using the OpenStack Explorer dashboard .

The OpenStack Explorer dashboard view is the most content-intensive view in Foglight for OpenStack. It provides access to summary (of alarms and resource utilizations) information for the object being viewed in the OpenStack Explorer dashboard.

The metrics and the amount of detail displayed in each view varies depending on the resource object or group of objects you select on the Topology tab.

The OpenStack Explorer heading, at the top of the OpenStack Explorer dashboard view, consists of three main components:

The alarm summary at the right of the view heading shows you the number of alarms at each severity level that are outstanding for the selected object. When you click an alarm count, you get a pop-up that lists the active alarms for the object.

Navigation tabs are located immediately below the selected resource object’s name. Click these tabs to see valuable information about the object being viewed.

Foglight tiles display information about the cloud infrastructure and the alarms currently active for the entities in the OpenStack infrastructure. For more information on Foglight tiles, see Foglight tiles .

For information the various tabs available in OpenStack Explorer, see the following:

Performance tab

This tab is available when the OpenStack Explorer is open. To find it, on the Topology tab on the navigation panel, select any configured object of type Region, Availability Zone, Host Aggregate, Host, Instance, or Volume. In the OpenStack Explorer, open the Performance tab.

NOTE: The Performance tab for Volume contains one embedded view, Volume Usage.

This tab displays the resource utilization for the selected object or group of objects over a selected time.

This tab is made up of the following embedded views:

This view shows the CPU Utilization summary for the selected component based on the total capacity of CPU % used during a selected time period.

This view shows the physical memory utilization summary for the selected component. The summary includes the amounts of memory that is swapped to disk, actively used, and consumed, all during a selected time period.

This view shows the network utilization summary for the selected component. The summary includes the average rate of network throughput, the amounts of data sent to and received from the network, and the amount of data dropped, all during a selected time period.

This view shows the disk utilization summary for the specified host. The summary includes the rates of data that is read from or written to the disk, the number of reads or writes per second, and the read or write latency in milliseconds, during a selected time period.

This view shows the usage statistics for the selected volume.

Related Documents

The document was helpful.

Select Rating

I easily found the information I needed.

Select Rating