Chat now with support
Chat with Support

Foglight for OpenStack 5.7.4 - User Guide

Using Foglight for OpenStack Interacting with Foglight for OpenStack dashboards Reference

FAQts tab

The FAQts tab is provided in the OpenStack Environment view through a navigation tab and is available for some particular object types in OpenStack Explorer.

In OpenStack Explorer, on the Topology tab, that appears on the navigation panel, select an availability zone or host.

Through three embedded views (the Categories, Question, and Answer views), the FAQts view enables you to ask questions and provides the answers to those questions.

Figure 33. FAQts view

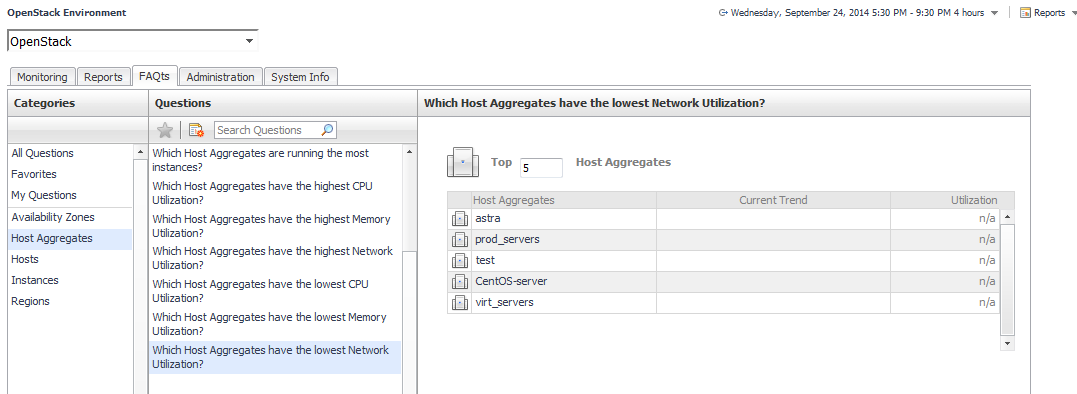
The FAQts view is made up of the following embedded views:

This view lists the categories for which questions can be answered for you by Foglight for OpenStack.

Click a category in the list to select it.

This view lists the questions, for the category selected in Categories, that can be answered for you by Foglight for OpenStack.

Click a question in the list to select it.

NOTE: To see all your favorites, click Favorites in the Categories view.
1
Click Create Report .
The Create Report wizard appears.

If the list of questions is long and you want to narrow it down, search for a particular text string using the Search Questions field.

This view provides an answer to the question selected in the Questions view. The answer appears in the following form:

Top x <objects of category>…

where x is the number of objects of the category you provided in the Categories view.

Specify x by entering a number. The answer is relative to the subset of the infrastructure you are viewing in the dashboard. For example, the top five datastores are different for each individual cluster in the infrastructure.

When no objects in your environment match the selected question and the selected time range, no data is displayed in the Answers table. Extend the time interval by selecting a different option from the Time Range, or select a different question.

To view detailed information about one of the monitored hosts, click the hosts’s name in the table to drill down to the Host_Name dashboard in OpenStack Explorer.

Host

This embedded view is available in the OpenStack Explorer. To find it, open the OpenStack Explorer and from the Topology tree select an individual Region, Availability Zone, or Host Aggregate.

Shown in the Host table is a list of all related hosts.

Shows a list of configured hosts related to the selected OpenStack group. Click an individual host name for detailed utilization and configuration information.

Memory tab

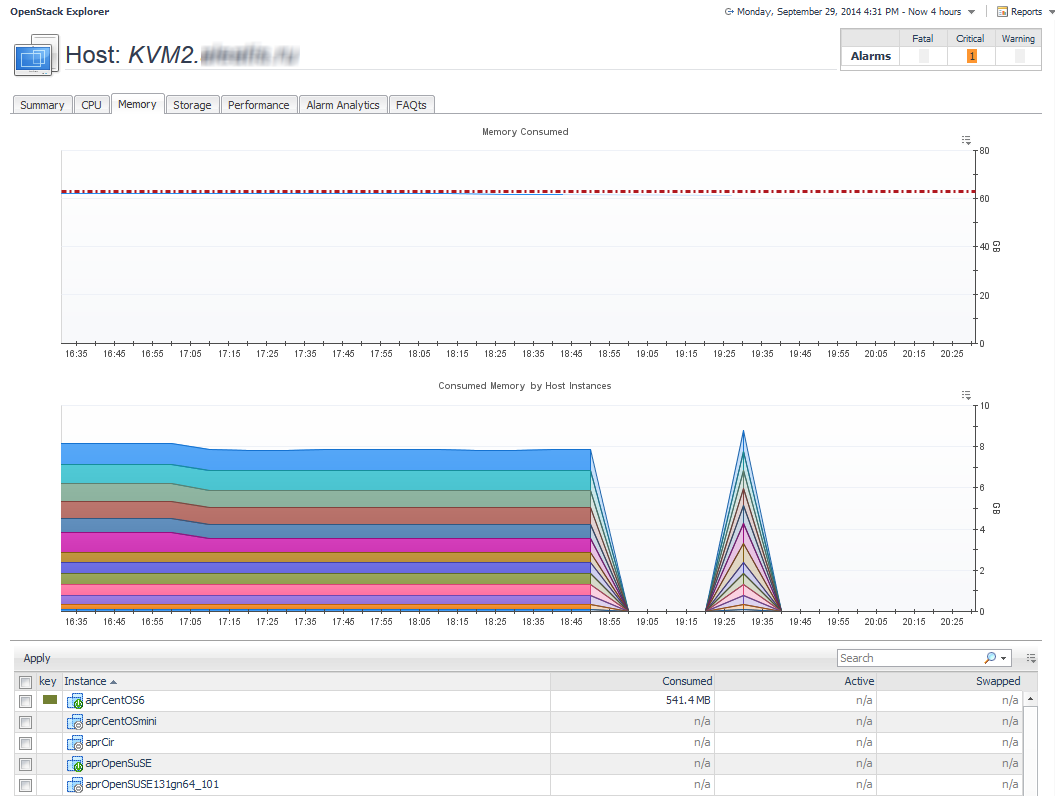
This tab is available in the OpenStack Explorer. To find it, open the OpenStack Explorer and on the Topology tab, that appears on the navigation panel, select a host instance. In the OpenStack Explorer, open the Memory tab.

The OpenStack Explorer’s Memory tab displays the combined memory consumed for a Host, showing the amount of memory each Instance that is running on that Host uses.

Figure 34. Memory tab

This view is made up of the following embedded views:

This view displays the combined memory that all the Instances running on a Host during a selected time period uses.

This view shows the amounts of memory each Instance that is running on the Host during the selected time period consumes. The Consumed Memory by Host Instances graph uses color to represent each instance on the host. If you hover over a color on the graph, a pop-up identifies the instance associated with that color.

This view displays a list of all discovered Instances related to the selected host. The default view shows the combined CPU usage by all the instances on the selected host.

2
Click the Apply button on the embedded view task bar.

Clicking the Instance name in the Instance column takes you to a summary view showing resource utilization and configuration information for that instance.

OpenStack Alarms dashboard view

The Alarms Overview groups the OpenStack alarms by object type and severity level. For monitoring alarms, use it as a starting point to quickly identify the sources of problems within the OpenStack infrastructure.

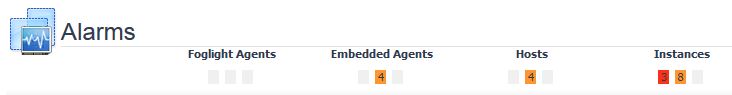
This view appears at the top of the OpenStack Alarms dashboard, preceding the Alarms List view.

Figure 35. Alarms Overview

The alarm counts are the total number of alarms for each alarm type: Normal, Warning, Critical, and Fatal. You can drill down on any alarm count by clicking it. The Alarms dialog box appears with a list of all related alarms.

Related Documents

The document was helpful.

Select Rating

I easily found the information I needed.

Select Rating