The action panel is at the far right of the Foglight browser interface.
The action panel provides you with easy access to several useful actions and tasks.
The Agents view is available on the OpenStack Environment dashboard. To find it, open the OpenStack Environment dashboard and click the Administration tab.
For more information about this dashboard, see Using the OpenStack Environment dashboard .
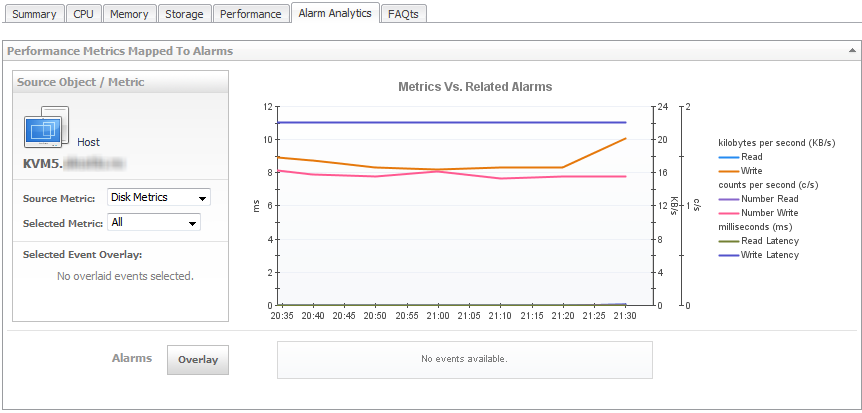
This tab is available in the OpenStack Explorer. To find it, open the OpenStack Explorer and on the Topology tab that appears on the navigation panel, select a Host, Instance, or Volume. In the OpenStack Explorer, open the Alarm Analytics tab.
The Alarm Analytics tab displays resource-related metrics collected about a Host, Instance, or Volume over a selected time period, and also shows any events that occurred during that time frame.
This view is made up of the following embedded views:
|
• |
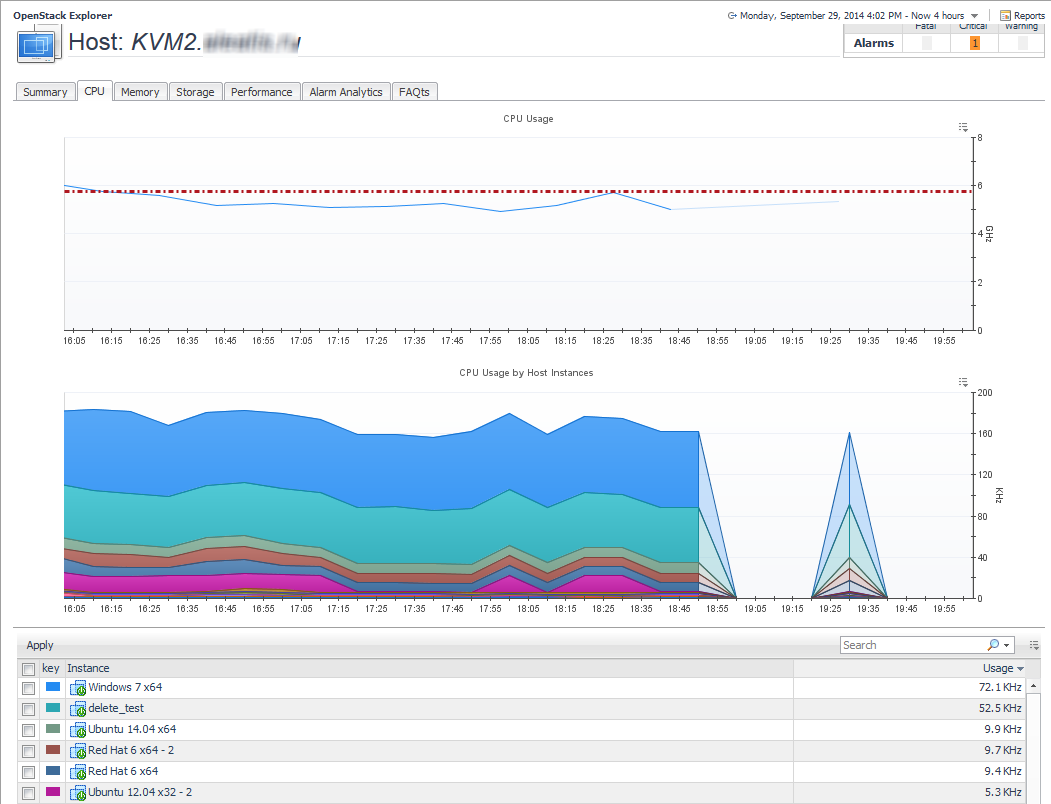
This tab is available in the OpenStack Explorer. To find it, open the OpenStack Explorer and on the Topology tab that appears on the navigation panel, select a host. In the OpenStack Explorer, open the CPU tab.
This view is made up of the following embedded views:
This view displays the amount of CPU each host used during a selected time period.
This view shows the amount of CPU the Host Instances used.
|
2 |
Click the Apply button on the embedded view task bar. |