Foglight provides intuitive dashboards with which to manage your lockboxes and credentials. To access these dashboards, on the navigation panel, click Dashboards > Administration > Credentials.
The appropriate lockboxes must be in place before you create credentials. The Manage Lockboxes dashboard displays a list of all lockboxes that are defined on the server, in addition to the System lockbox that is included with the Management Server.
|
1 |
Click Manage Credentials on the Credentials dashboard. |
|
2 |
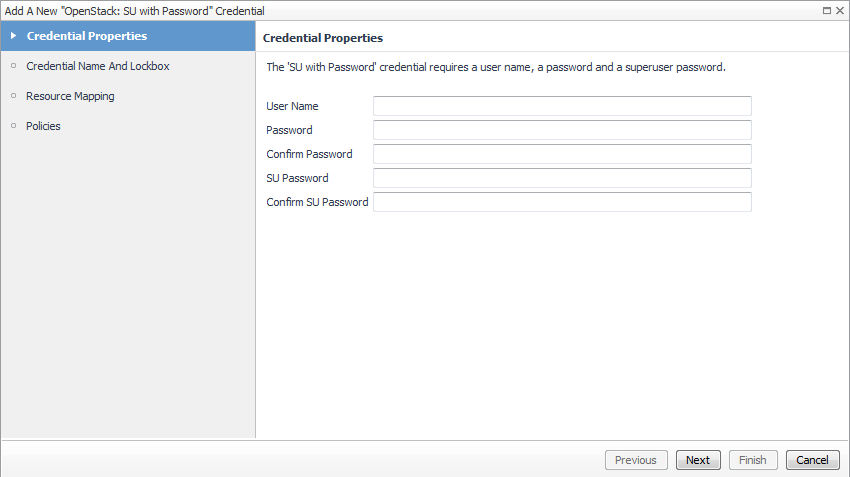
Click Add. |
|
4 |
|
5 |
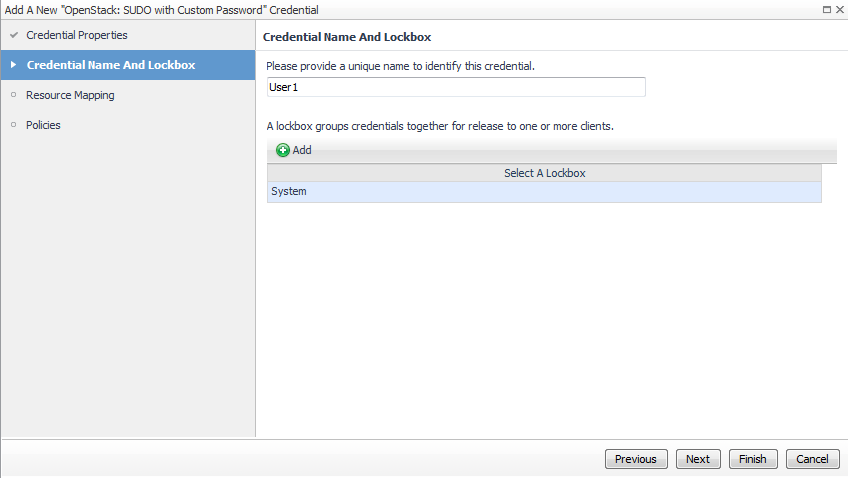
On the Credential Name and Lockbox page, provide a name to identify the credential, and select a lockbox in which you want to keep the credential. A lockbox can be used to group credentials for access or security. In smaller Foglight installations, using the default System lockbox should be sufficient. |
|
6 |
|
7 |
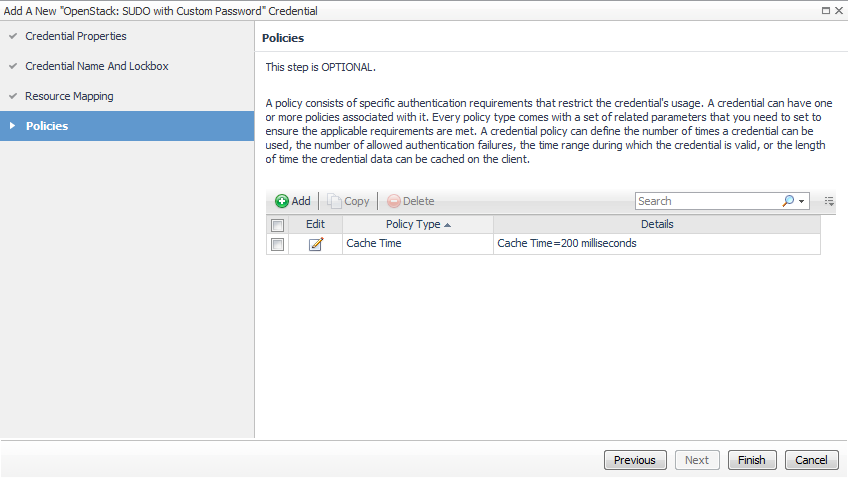
Optional-On the Policies page, define one or more policies for this credential. |
For more information on the Credentials dashboard, see Foglight Administration and Configuration Guide.
|
1 |
For more information on managing Lockboxes, see the Foglight Administration Guide.
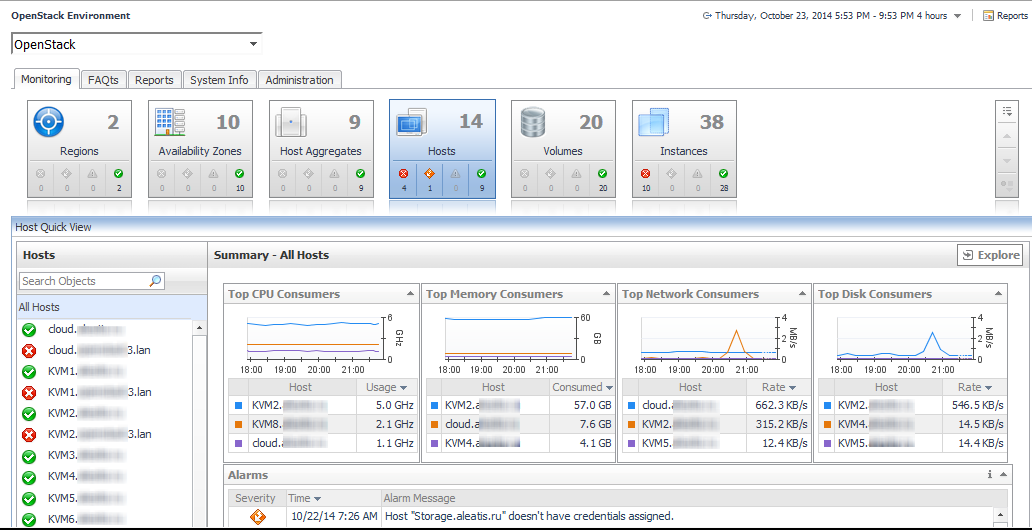
The OpenStack Environment Monitoring tab contains tiles which represent the various configured resource objects found in the OpenStack infrastructure.
For each resource object type (Regions, Availability Zones, Host Aggregates, Hosts, Volumes, and Instances) the default view when clicking a tile is all objects, such as All Hosts. This view can be seen in the object list view in the left frame of the Quick View with top resource consumers in the group in the right frame.
The four embedded views in the right frame display graphs and tables showing the following:
|
• |
Top CPU Consumers — those members with the highest average CPU utilization. |
|
• |
Top Memory Consumers — those members with the highest memory utilization. |
|
• |
Top Network Consumers — those members consuming most network bandwidth. |
|
• |
Top Disk Consumers — those members with the highest average disk utilization. |
An embedded Alarms view displays a list of alarms and when they were raised.
|
1 |
|
3 |
Click Apply. |
For more information, see these topics:
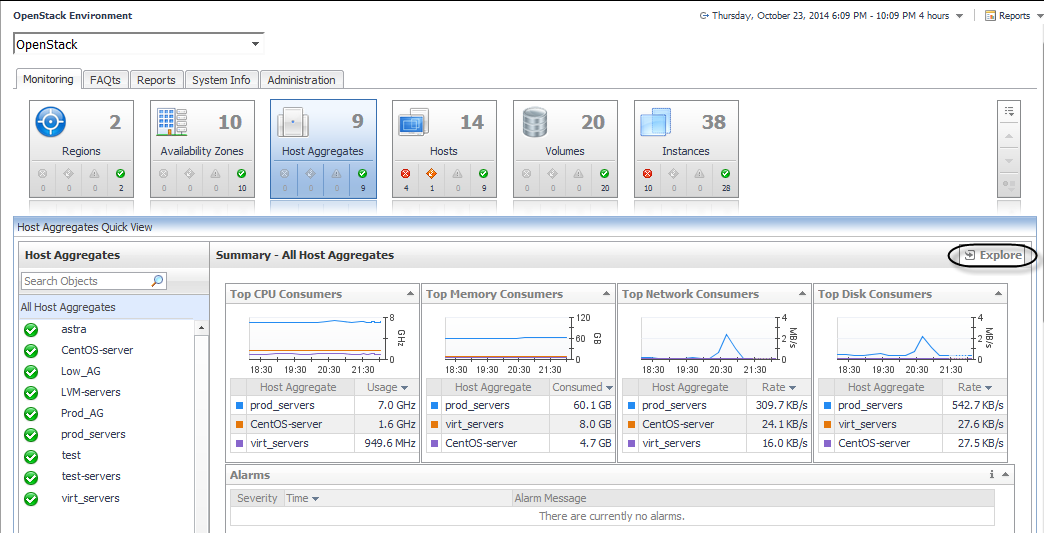
The default view is a summary of all configured objects of the chosen resource type.
After you select a infrastructure resource object in the left frame, the Explore link in the upper-right corner is enabled. Use the link to drill down to the OpenStack Explorer view of the object to see detailed information about the selected object. For more information, see Using the OpenStack Explorer dashboard .
For reference information on the Quick View, see Quick View .
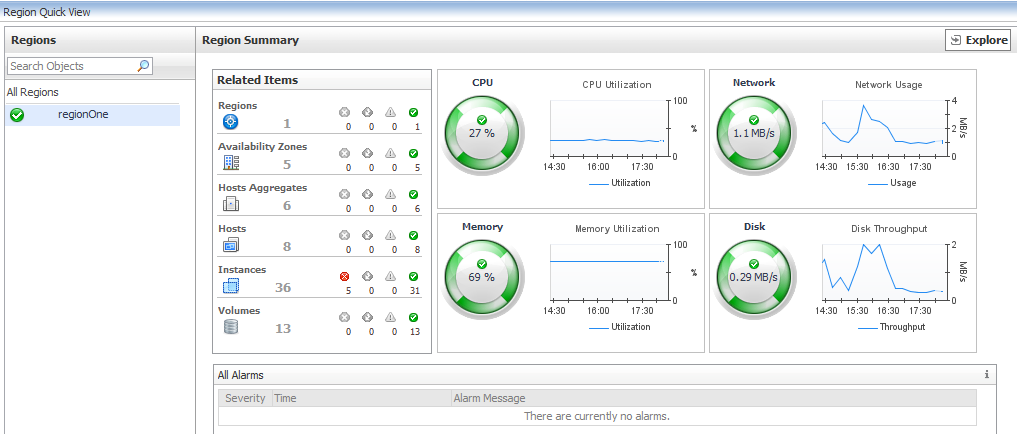
When you click the Regions tile, a list of all configured regions and summary information for all the regions is shown in the Region Quick View. By default, All Regions is selected with charts showing the top CPU, memory, network, and storage consumers in the summary frame. A table of relevant alarms is also shown.
Click the Explore link in the upper right of the Quick View to go to the OpenStack Explorer Summary tab to see more detailed information about the selected region.
Clicking an object type in the Related Items view displays a list of related objects of that type along with their statuses.