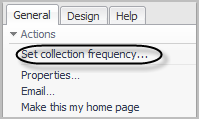
Setting Collection Frequency
|
2 |
If it is not already selected, click the General tab. |
|
3 |
|
5 |
Click OK to save and apply your changes. |
Monitoring and Investigating JMX Data
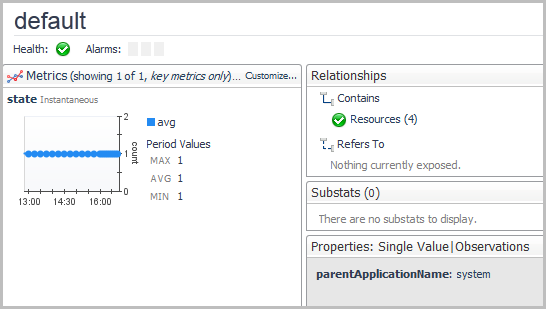
Foglight for JMX gathers JMX data. This data is displayed in the Application Servers > Monitor dashboard. You can review full details about the MBeans being monitored in the Systems and Servers tabs of this dashboard.
|
NOTE: If you do not see the Application Servers > Monitor dashboard listed in the navigation panel, inform your Foglight Systems Administrator. Your Administrator can add your user account to the “JMX Administrator” or “JMX Read-only User” group. You must have one of these roles to be able to see the Custom Applications Monitor Homes dashboard. For more information about users and groups, see the Foglight for JMX Administration and Configuration Guide. |
|
• |
On the navigation panel, under Dashboards, click Applications Servers > Monitor. |
|
• |
On the navigation panel, under Dashboards, click Application Servers > JMX > Explorer. |
Viewing MBean Data in the JMX Explorer Dashboard
|
• |
On the navigation panel, under Dashboards, click Application Servers > JMX > Explorer. |

Viewing Monitored MBeans
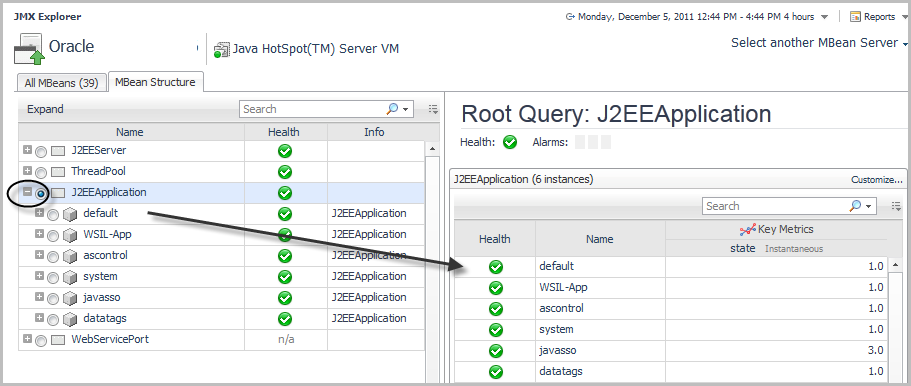
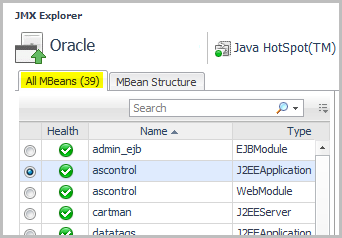
The MBeans table on the left side of the JMX Explorer dashboard lists the MBeans that are currently being monitored. You can display the information in a List or Structure view. Selecting an MBean from this table populates the information in the MBean view on the right. You can review the System, Server, and JVM for the selected MBean, any related relationships the MBean has, its metrics, sub-stats (if available), and properties. The table list is based on the exposed relationships configured through the JMX Administration dashboard. For more information about relationships, see On the Exposed Relationships page, expose one or more named relationships. .
The All MBeans tab provides a high-level overview of the monitored MBeans, their health, and their type.
The MBean Structure tab provides the same information in a tree format that allows you to review the structure of the MBean instances. It also provides the MBean health status.