A Radar layout is used to create a chart that displays three or more* Object properties on different axes which start from the same central point.
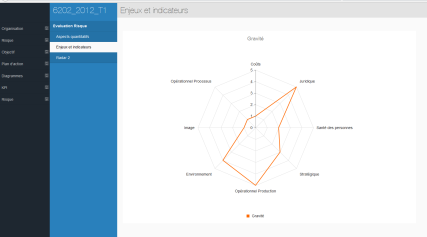
A simple Radar chart uses one line to display the different properties of a single object (a Property Group).
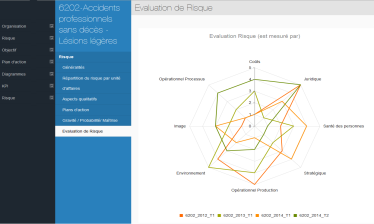
The Radar layout can also overlay multiple lines into a single chart to display the various properties of an Object List. Each line is used to represent a different Object.
With the Radar layout, you can use one chart to visually consolidate multiple values of a single object, or multiple values of many objects, against one another.
|
|
*We recommend that 3-10 properties or values are used per Object for clarity purposes. |
|---|
Why and how should you use one?
Use the Radar layout when you want to visually compare the different properties of a single object, or of many objects, against each other.
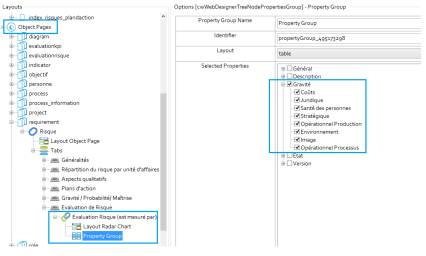
You can use radar layout list in an index page or a single page. To do this, add an index page (or add a “New Association” for single pages).
Next, add a properties group and under “Selected Properties”, tick the properties that you wish to display in the radar layout. Please note that only integer properties (i.e numbers) can be represented in radar layout.
Where and when can you use one?
Use the table below to see where you can use the Radar Layout:
|
Page Type |
Parent node |
Tabs |
Number on page |
Editable |
|---|---|---|---|---|
|
Index Page |
Object Type node |
Yes - optional |
Any |
No |
|
Object Page |
Association Type node |
Yes - mandatory |
Any |
No |
What do you want to do?
Use a Radar Layout
To create a Radar layout for the properties of a single object:
This is either the Object Type Node on an Index Page or an Association Type Node on an Object Page.
|
|
Selection is only applicable for integer Properties as Radar Layout requires that only integer values are used to create charts. Decimal numbers are permitted, however. |
|---|
|
|
|
|---|
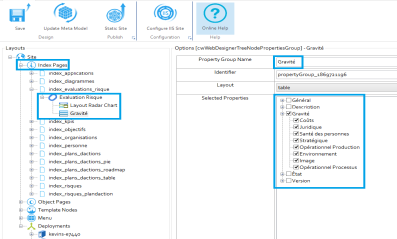
In Evolve Designer, locate the Parent Node that you want your Radar Layout to be applied to.
From the Layout drop-down menu, select Radar.
In the Selected Properties area of the Parent Node, select all the properties that you want to display in the Radar.
Save and Publish your Site.
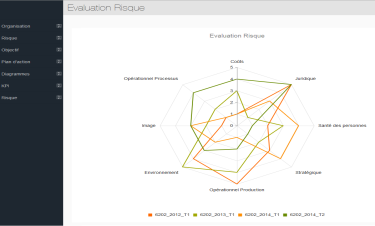
Navigate to the appropriate Object or Index Page on your Site, and the Radar chart will be displayed.
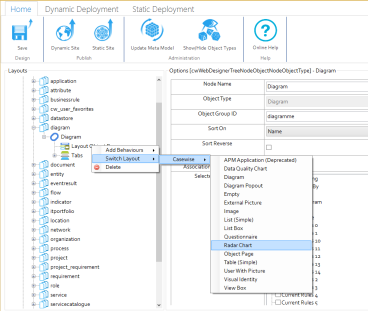
To create a Radar layout for the properties of many objects:
This is either the Object Type Node on an Index Page or an Association Type Node on an Object Page.
Choose Switch Layout > CW > Radar.
In Evolve Designer, locate the Parent Node that you want your Radar Layout to be applied to.
Right-click beneath the Parent Node Layout to change the Layout to Radar:
In the Selected Properties area of the Parent Node, select all the properties that you want to display in the Radar.
Save and Publish your Site.
Navigate to the appropriate Object or Index Page on your Site, and the Radar chart will be displayed.
|
|
|
|---|---|
|
|
|
|
|
When inserting a Property Group, we recommend you only display a small number of properties in any particular group - your page will look much better if you restrict the number of properties in each one. |
|---|