
Using the Web Component Tutorial
Browser Interface Views
How to Use this Tutorial
Tutorial 1: Drag and Drop
Tutorial 2: Creating a Dashboard
Constructing the Tutorial Module
Configuring a Query
Configuring a Row-Oriented Table
Building the Dashboard
Summary
Tutorial 3: Adding a Drilldown Page
Preliminary Setup
Adding a Column of Aggregate Alarms to the Table
Adding a Dependent Page
Summary
Tutorial 4: Adding Views
Designing the Page
Preliminary Setup
Defining the Alarms Query
Configuring a Table of Alarms
Configuring a Chart Component
Configuring a Label with an Action
Configuring the Drilldown Page
Configuring a Drop-Down List
Flowing Monitored Hosts to Host Details T3
Adding a Customizer
Adding Nested Views
Summary
Tutorial 5: Using a Grid
Tutorial 6: Reports
Configuring a Query
Creating a Basic Report Page
Creating a More Elaborate Hosts Table
Adding a Header
Adding a Footer
Adding an Iterator for a Multi-Page Report
Summary
Tutorial 7: Creating a Form
About this Tutorial
Defining the Enumerated Types for Manager and Staff
Defining the Manager and Staff Types
Defining the Company Type
Defining the Functions for Adding and Removing a Manager
Defining the Labels
Defining the Bean Input Components
Defining the Grid Layout
Defining the Dialog
Defining the Table of Managers
Summary
Tutorial 8: Renderers
Tutorial 9: Adding Questions and Answers
Working with Associations and Question Viewers
Tutorial 10: Sending Messages to Other Users
About Domain Associations
About Question Associations
About Category Associations
About Question Viewers
Building Associations for Your Question Viewer
Populating the Question Viewer with Questions and Answers
Building a Mini-Viewer
Summary
Configuring Table Columns
|
1 |
Open the Configuration tab. |
|
2 |
On the Configuration tab, ensure that the Show Advanced Properties check box is clear. The advanced properties are less likely to be used when constructing a basic version of the component which is what we are about to do in this procedure. |
|
3 |
In the table, locate the Rows row. In the Value column, click Edit |
The Edit - Rows dialog box appears.
|
4 |
In the Edit - Rows dialog box, in the Query box, click |
|
6 |
In the Property column, expand the Columns node, and then the Column node that appears immediately below. |
A Value node appears, along with an empty row with a Click to add button.
|
7 |
Figure 5. Value column, editing
|
8 |
From the menu that appears, choose Context. |
The Edit - Value dialog box opens.
|
9 |
In the Edit - Value dialog box, in the Input Key box, click |
|
10 |
As each row is rendered at runtime, the context key currentRow contains a pointer to the current object in the list of hosts. Any property of a host object that can be rendered as a string can be selected as a column entry.
|
11 |
Click Set. |
The Edit - Value dialog box closes.
|
12 |
Click Save to save your changes to the view. |
Figure 6. Saving changes to the view
Building the Dashboard
|
1 |
The Add View dialog box appears.
|
2 |
|
3 |
Figure 7. Choosing a fixed layout
Click OK.
|
4 |
|
5 |
|
6 |
|
7 |
Set the Preferred Width and Preferred Height values. You can edit these values later when you have seen the table displayed, so you can choose any values you want. For now, set Preferred Width to 300 and Preferred Height to 150. |
|
8 |
Leave the Refresh Interval box blank. |
|
9 |
On the right of Purpose, click Edit ( ). In the dwell that appears, select Dashboard, and leave all the other check boxes cleared. Since this view is a dashboard container, its purpose needs to reflect that to be enable access to it later on.
Click Apply in the dwell to save this change and close the dwell.
|
11 |
|
12 |
|
13 |
Click Save to save your work so far. |
Figure 8. Definitions pane in view mode

|
14 |
Click Edit to continue modifying the dashboard. |
Adding the Table to the Dashboard
To do that you use the Configuration tab.
|
1 |
Open the Configuration tab. |
|
2 |
|
3 |
In the menu that appears, choose Set to Binding > String Template. |
The Edit - Title dialog box appears.
|
4 |
|
5 |
Open the Layout tab. |
|
6 |
The Add View dialog box appears.
|
7 |
The Add View dialog box refreshes.
|
8 |
The Add View dialog box refreshes.
|
9 |
Set the position and size of the table, indicate if you want scroll bars, and whether to show a title and a border. Check Show Title and Show Border and leave the other settings at their default values. |
|
10 |
|
11 |
Click Save to save the changes to the view. |
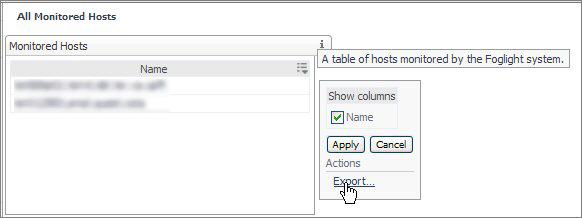
On the navigation panel, choose My Definitions > All Hosts.
The All Hosts dashboard appears in the display area. You see that All Monitored Hosts appears in the breadcrumb trail at the upper left of the view, and that the dashboard contains a table titled Monitored Hosts.
Figure 9. Accessing the newly built dashboard
Summary
You have viewed the component by navigating to All Hosts in the Dashboards area under My Definitions.