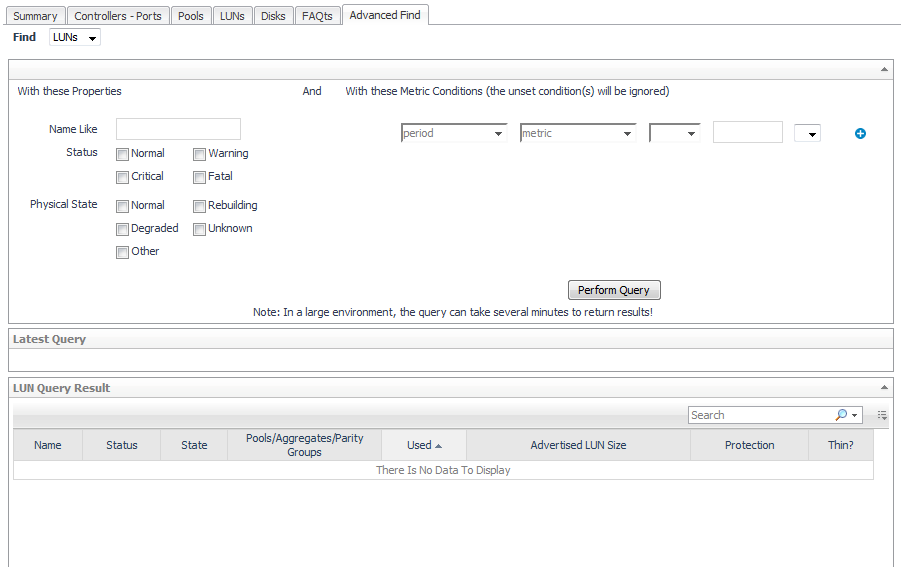
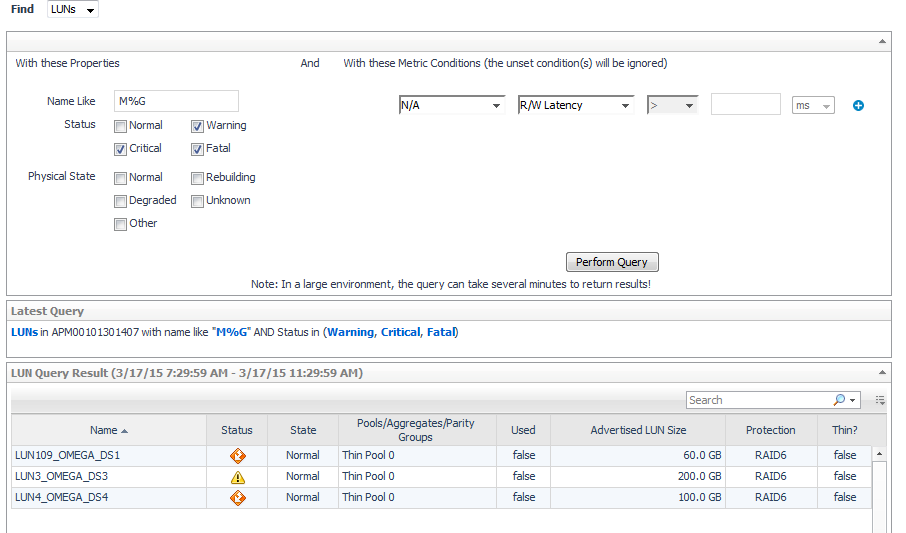
Queries can be constructed using a combination of Property conditions and Metric conditions.
 Advanced Find
|
3 |
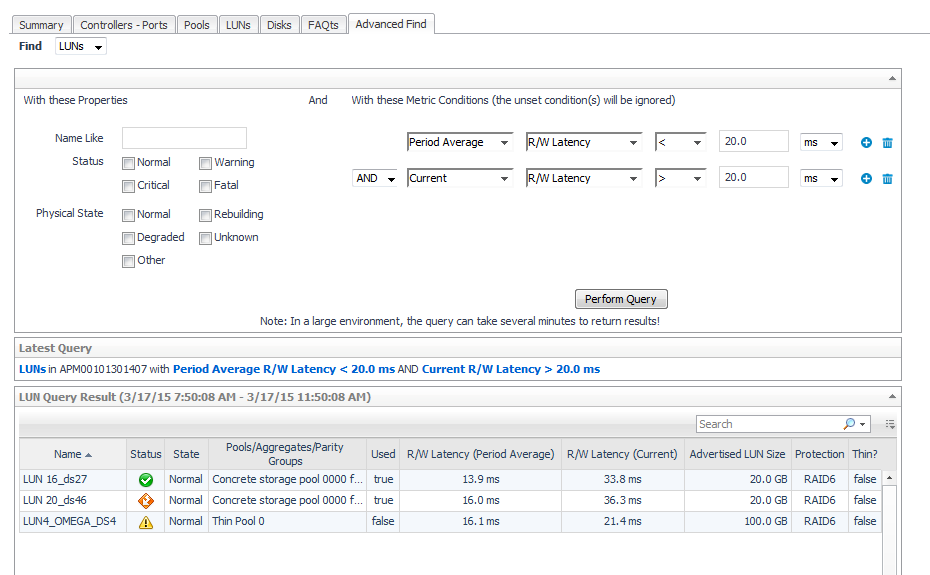
Click Perform Query. |
|
• |
_ is a positional wildcard, that can match a single character. For example, C_D would match decode, but would not match record |
|
• |
To find entities with current status or physical state:
|
3 |
Click Perform Query. |
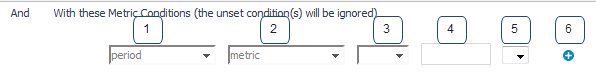 Metrics conditions
|
1 |
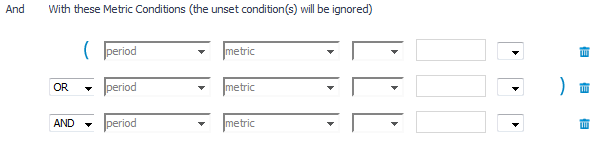
Period. Refers to the time range on the zonar displayed in the upper right-hand corner. Select the time the query should use for the metric values. When n/a is selected, this condition is ignored. |
|
2 |
Metric. This drop down shows the metrics available for this entity type for this vendor. |
|
6 |
Click the + icon if you want to add another condition. The next condition row will be preceded by a AND/OR selector. A trash can icon will appear to the right of the + icon to let you remove a condition. |
This section covers the following topics:
A component dashboard is a drill-down view that displays physical details about a selected component, performance and capacity metrics, and alarms. Some also include a topology diagram that shows how the component fits into the monitored environment; for more information, see Exploring Connectivity with SAN Topology Diagrams.
For information about each type of component dashboard, see the following topics:
|
2 |
Review overall performance in the Summary tab. |
|
• |
Aggregate Details. Displays the aggregate’s status, parent filer, health score, and current values for Advertised NASVolumes Size, Total Usable Capacity, Available Usable Capacity, Overcommitment, Data Rate, and Ops Rate. Click a |
|
• |
Pool Performance. Displays the same performance metrics found in the Aggregate Details view, but in chart format. |
|
• |
Perform Pool Change Analysis. Click to identify the NASVolumes and LUNs primarily responsible for increased I/O. For more information, see Analyzing the Pool. |
|
• |
Perform Pool Load Analysis. Click to identify the busiest NASVolumes and LUNs, and rank them based on their activity during the same time range over the last 30 days. For more information, see Analyzing the Pool. |
|
3 |
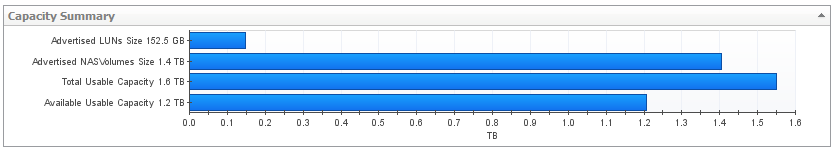
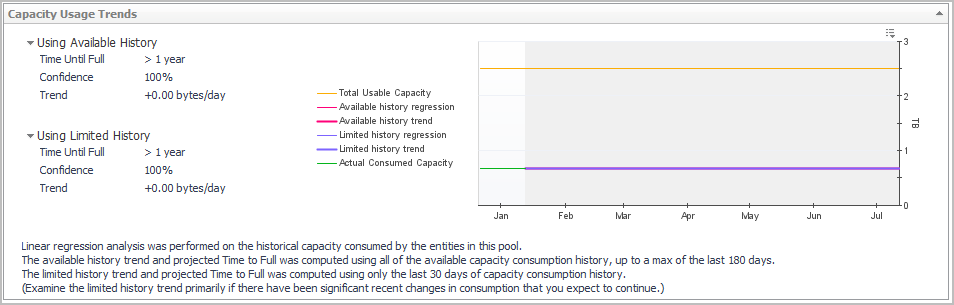
Click the Capacity tab. |
|
• |
Capacity Usage Trends: Chart provides a visual display of the estimated capacity consumption in the future, based on a regression analysis of the historical capacity consumption. |
|
4 |
Click the Consumers tab. |
|
• |
Aggregate Details. Displays the aggregate’s status, parent filer, and current values for Advertised LUNs Size, Advertised NASVolumes Size, Total Usable Capacity, Available Usable Capacity, and Overcommitment. |
|
• |
NASVolumes Using This Aggregate. For each volume, displays its name, status, physical state, and whether the NASVolume is used by an entity in the monitored environment. The metric columns display current values for Data Rate, Latency, Advertised NASVolumes Size, Used Capacity, and % Used. Click a |
|
• |
LUNs Using This Aggregate. For each LUN, displays its name, status, physical state, and whether the LUN is used by an entity in the monitored environment. The metric columns display current values for Data Rate, Ops Rate, Latency, % Busy, and Advertised LUNs Size. Click a |
|
5 |
Click the Disks tab. |
|
• |
Click a NASVolume name. See Investigating a NASVolume (includes a topology diagram). |
|
• |
Click a LUN name. See Investigating a LUN (includes a topology diagram). |