
Connection Status
|
• |
On the navigation panel, under Dashboards, click Administration. In the Investigate column, Server section, click Connections. |
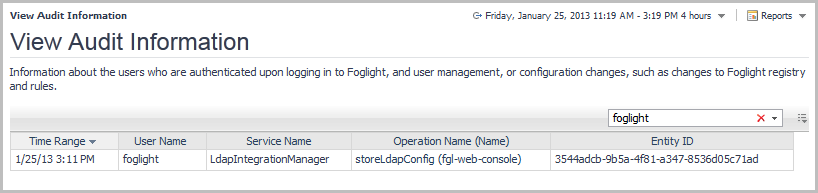
View Audit Information
|
1 |
|
• |
Time Range: Displays the date and time at which the specified action occurred. |
|
• |
User Name: Displays the user name for the user who caused the action to be performed. |
|
• |
Service Name: Displays the name of the Foglight service that performed the action. |
|
• |
Operation Name (Name): Displays the operation that was performed by Foglight. If applicable, the name of the item that was changed is also displayed in this column. |
|
• |
Entity ID: Displays the entity ID. |
Online-Only Topics
Cartridge Inventory and Components for Download
Installation is the first step in adding a cartridge to the Foglight Management Server. A cartridge file has the extension.car. Installing the CAR file causes the Management Server to be aware of all cartridges in the CAR file.
Use the Cartridge Inventory dashboard to install a cartridge. Alternatively, use the cartridge:install command. This fglcmd command allows you to install one or more cartridges at a time. For more information, see the Command-Line Reference Guide.
Some Foglight cartridges are license-protected, while others do not require a license. You can install any cartridges, regardless of their license requirements. However, installing a license-protected cartridge without adding its license results in that cartridge being disabled by default. For more information, see Managing Licenses.
|
TIP: To view only cartridges which are enabled, click the View only Enabled Cartridges check box at the bottom of the screen. In addition, you can sort by the Version and Creation Date columns. |
|
1 |
|
2 |
On the Cartridge Inventory dashboard, click Install Cartridge. |
|
3 |
In the Install Cartridge dialog box, click Browse, and navigate to the cartridge file that you want to install. |
|
4 |
Ensure that the Enable on install check box is selected. |
|
5 |
Click Install Cartridge. |
|
6 |
|
8 |
License-protected cartridges only. Install the cartridge license. |
A cartridge can be in one of the following states:
|
• |
|
• |
You can install any cartridge, regardless of the contents of your Foglight license. Installing a license-protected cartridge without adding its license results in that cartridge being disabled by default. Before enabling a license-protected cartridge, ensure that its license is installed and current. For more information, see Managing Licenses.
|
1 |
|
2 |
License-protected cartridges only. Ensure that the appropriate cartridge license is installed and valid. For more information, see Managing Licenses. |
|
TIP: The Status column contains icons that indicate if a cartridge is enabled |
|
4 |
Click Enable. |
|
5 |
|
6 |
Observe the Status column of the newly enabled cartridge. This column contains the Enabled icon |
|
1 |
On the navigation panel, under Dashboards, select Administration > Cartridges > Cartridge Inventory. |
|
TIP: The Status column contains icons that indicate if a cartridge is enabled |
|
3 |
Click Disable. |
|
4 |
|
5 |
|
6 |
Observe the Status column of the newly disabled cartridge. |
A .car file can contain multiple cartridges. When you remove all of the cartridges that come in a .car file, the .car file is deleted.
Before removing a cartridge, make sure that the cartridge is disabled, and that any agent instances that come with the cartridge do not collect data. Uninstalling a cartridge while its agents are still collecting data prevents the Foglight Management Server from recognizing the data that the agents collect. For more information about disabling a cartridge, see Enable or disable Foglight cartridges.
|
1 |
On the navigation panel, under Dashboards, select Administration > Cartridges > Cartridge Inventory. |
|
TIP: The Status column contains icons that indicate if a cartridge is enabled |
|
3 |
Click Uninstall. |
|
4 |
|
5 |
|
1 |
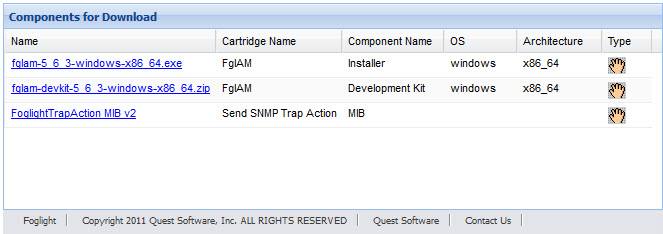
On the navigation panel, under Dashboards, choose Administration > Cartridges > Components for Download. |
|
2 |
Optional — View the component details. On the Components for Download dashboard, click the Name column of the row containing the cartridge component that you want to download. |
|
TIP: The Component for Download URL contains a direct link to the component file that is accessible without needing to login. This can be used to download components in headless environments when browser access is not possible. |
|
3 |
On the Components for Download dashboard, click the Installer column of the row containing the cartridge component that you want to download. |
|
• |
host is the name of the computer on which the Foglight Management Server is running. |
|
• |
port is the HTTP port number used by the Foglight Management Server. |
|
2 |
In the Components for Download view, click the Name column of the row containing the agent component that you want to download. |
|
3 |
Click Download Installer to download the cartridge component. |
|
• |
command is the name of the command-line utility that you are using to download the agent component. |
|
• |
host is the name of the computer on which the Foglight Management Server is running. |
|
• |
port is the HTTP port number used by the Foglight Management Server. The default port number is 8080. |
|
• |
file_name is the name of the file that you want to update. |
Some Foglight dashboards have reports associated with them. This allows you to run a report based on the current dashboard. You can generate the report using the Reports menu in the top-right corner.
The Cartridge Inventory dashboard is associated with the Cartridge Inventory Report. Run this report by choosing Cartridge Inventory Report from the Reports menu.
The report wizard provides more information about the Cartridge Inventory Report. For more information about reports in Foglight, see the Foglight User Help.
This dashboard is a starting point for viewing and managing Foglight Agent Managers. It displays a list of all Agent Managers that exist in your environment, and allows you to manage them. To access the Agent Managers dashboard, from the navigation panel, click Dashboards > Administration > Agents > Agent Managers.
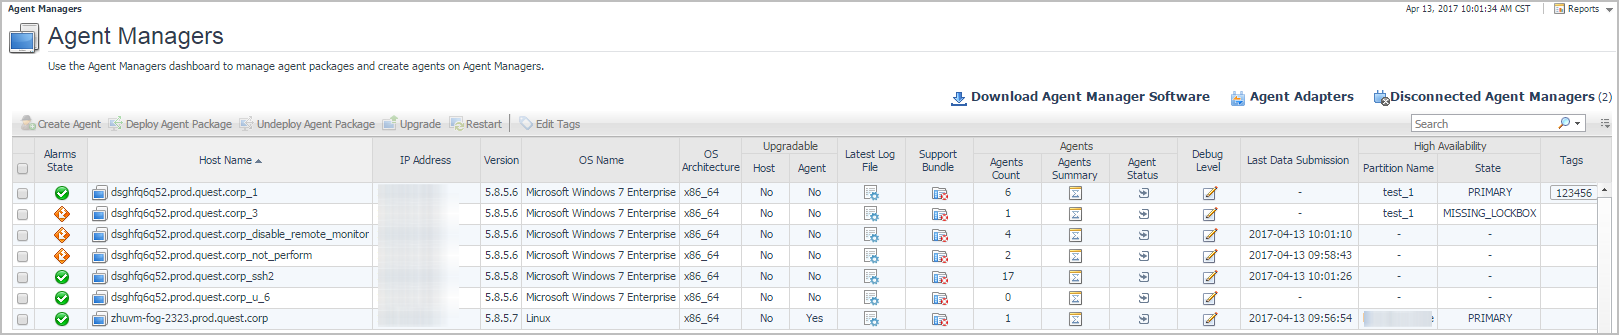
You can select one or more hosts and click a button just above the table to perform a desired operation on the selected host. For example, to create an agent instance and manage it by a specific Agent Manager, select an Agent Manager, and click Create Agent. The following commands are available:
|
• |
Create Agent: Click to create an agent on one or more selected hosts. For more information, see Create agent instances on monitored hosts. |
|
• |
Deploy Agent Package: Click to deploy an agent package to one or more selected hosts. For more information, see Deploy an agent package to a monitored host. |
|
• |
Undeploy Agent Package: Click to remove an agent package from one or more selected hosts. For more information, see Undeploy an agent package. |
|
• |
Upgrade: Click to upgrade one or more selected Agent Managers. For more information, see Upgrade an Agent Manager. |
|
• |
Restart: Click to restart one or more selected Agent Managers. |
|
• |
Edit Tags: Choose Edit Tags to add or edit the tags of one or more selected Agent Managers. For more information, see Edit agent tags. |
|
• |
Alarms State: The highest severity alarm generated against the Agent Manager: Normal |
|
• |
Host Name: The name of the machine on which the Agent Manager is installed. |
|
• |
IP Address: The IP address of the machine on which the Agent Manager is installed. |
|
• |
Type: The type of the Agent Manager. FglAM stands for the Foglight Agent Manager. |
|
• |
Version: The version number of the Agent Manager installed on the host. |
|
• |
Build: The build ID of the installed Agent Manager. |
|
• |
OS Name: The OS running on the Agent Manager host. |
|
• |
|
• |
Secure Mode: Indicates the type of the connection between the Agent Manager and the Management Server: HTTPS (secure) or HTTP (non-secure). |
|
• |
Upgradeable, Host: Indicates if an upgrade is available for the Agent Manager. |
|
• |
Upgradeable, Agent: Indicates if an upgrade is available for one or more agents running on the Agent Manager. |
|
• |
Concentrator: Indicates whether the Agent Manager is configured to accept downstream connections (Yes or No). |
|
• |
Latest Log File: Click to obtain a copy of the latest Agent Manager log file. |
|
• |
Last Data Submission: Displays the last date submission time when any of the agents running on this agent manager submits the data. |
|
• |
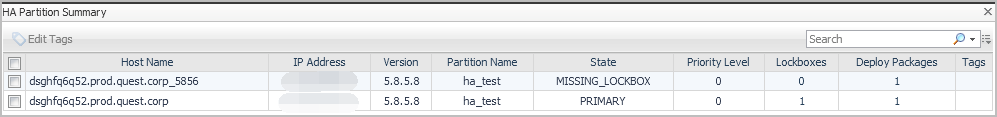
High Availability: Indicates if the Agent Manager is running in High Availability (HA) mode, which includes the following attributes: |
|
• |
Partition Name: Displays the name of the HA partition in which the agent manager locates. |
|
• |
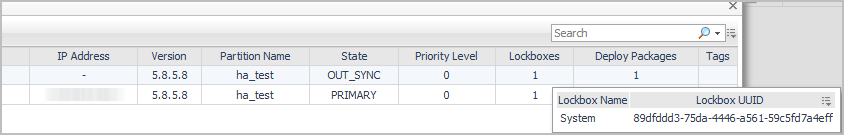
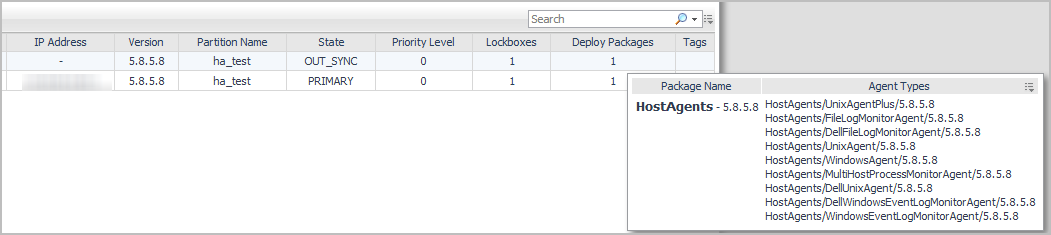
State: Shows current HA state of the agent manager, including PRIMARY, STANDBY, OUT_SYNC, CONFIGURING, MISSING_LOCKBOX, and BROKEN. |
|
• |
PRIMARY: The primary agent manager manages the HA agents and synchronizes its state to other agent managers in the same HA partition. |
|
• |
STANDBY: The agent manager has fully synchronized its state with the primary agent manager and is eligible for fail-over. |
|
• |
OUT_SYNC: The agent manager is out of synchronization with the primary agent manager and is not eligible for fail-over. |
|
• |
CONFIGURING: The agent manager is synchronizing its state with the primary agent manager and is not eligible for fail-over. |
|
• |
MISSING_LOCKBOX: The agent manager is missing some lockboxes compared to the primary agent manager and is not eligible for fail-over. |
|
• |
BROKEN: The agent manager has failed to deploy one or more agent packages during synchronization and is not eligible for fail-over. |
|
• |
Hover over or click the Lockboxes column to show detailed information of the lockboxes deployed on the target agent manager. |
|
• |
Hover over or click the Deploy Packages column to show the list of packages. |
|
• |
Support Bundle: Click to create an Agent Manager support bundle, if instructed by Quest Support. |
|
• |
Agents: The information of the selected agent host, which includes the following attributes: |
|
• |
Agents Count: Shows the total count of agents. |
|
• |
Agents Summary: Click or hover over this column to see which agents are deployed to the Agent Manager. |
|
• |
Agent Status: Click to navigate to the Agent Status dashboard. For more information about this dashboard, see Explore the Agent Status dashboard. |
|
• |
Debug Level: Click to edit the debug level of logs from the Agent Manager dashboard. For more information, see Edit the debug level. |
|
• |
Tags: The tags of the selected Agent Manager. Click Edit Tags above the table to edit the tag of selected Agent Manager(s). For more information, see Edit agent tags. |
|
• |
Refresh: Refreshes the Tasks table to reflect the current status of any running or completed tasks. |
|
• |
Clean Completed Tasks: Removes any completed tasks from the table. |
|
• |
Status: The task status. |
|
• |
Action: The action performed by the tasks. |
|
• |
Details: Any details related to the task. |
|
• |
Host Name: The name of the host on which the task is running. |
|
• |
Status Message: A message associated with the task status. |
|
• |
Duration Time: The amount of time needed to complete the task. |
Two additional columns are not hidden by default. You can display them in the Customizer :
|
• |
Start Time: The time when the task started. |
|
• |
End Time: The time when the task ended. |
This dashboard is a starting point for viewing and managing Foglight Agents. It displays a list of all monitoring agent instances that exist in your environment, and allows you to manage them. To access the Agent Status dashboard, from the navigation panel, click Dashboards > Administration > Agents > Agent Status.
You can select one or more hosts and click a button just above the table to perform a desired operation on the selected host. For example, to activate an agent instance, select it in the table, and click Activate. The following commands are available:
|
• |
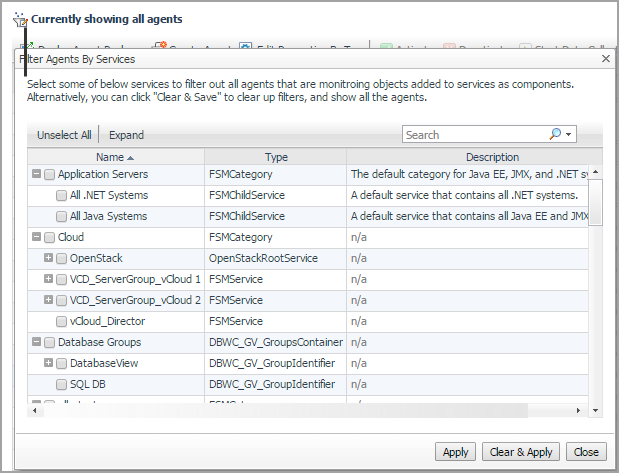
Agent filter: Click to filter agents by services. For more information, see Filter Agents By Services. |
|
• |
Deploy Agent Package: Click to deploy an agent package to one or more selected hosts. For more information, see Deploy an agent package to a monitored host. |
|
• |
Create Agent: Click to create an agent on one or more selected hosts. For more information, see Create agent instances on monitored hosts. |
|
• |
Edit Properties By Tag: Click to select a tag associated with one or more agent instances whose properties you want to edit. |
|
• |
Activate: Click to activate one or more selected agent instances. For more information, see Activate or deactivate agent instances. |
|
• |
Deactivate: Click to deactivate one or more selected agent instances. For more information, see Activate or deactivate agent instances. |
|
• |
Start Data Collection: Click to initiate data collection for one or more selected agent instances. For more information, see Start or stop data collection. |
|
• |
Stop Data Collection: Click to stop data collection for one or more selected agent instances. For more information, see Start or stop data collection. |
|
• |
Edit Properties: Choose Edit Properties to edit the properties of one or more selected agent instances. For more information, see Edit instance-specific agent properties. |
|
• |
Delete: Click to delete one or more selected agent instances. For more information, see Delete an agent instance. |
|
• |
Upgrade: Click to upgrade one or more selected agent instances to a more recent version. For more information, see Upgrade an Agent Manager. |
|
• |
Move: Click to move one or more FglAM agents to the other FglAM host. For more information, see Moving FglAM agents. |
|
• |
Edit Tags: Choose Edit Tags to add or edit the tags of one or more selected agent instances. For more information, see Edit agent tags. |
|
• |
State: The highest severity alarm generated against the agent instance: Normal |
|
• |
Status: The status of the agent process: Active |
|
• |
Collecting Data: An indication of whether the agent instance is collecting data: Not Collecting Data |
|
• |
Private Property: An indication of whether the agent instance uses private properties , or not |
|
• |
Agent Name: The name of the agent instance. |
|
• |
Agent Manager: The name of the machine on which the Agent Manager that manages this agent instance is installed. |
|
• |
Namespace: The Namespace the agent type belongs to. A namespace is a collection of agent types that share the same concept. |
|
• |
Type: The type of the agent instance. |
|
• |
|
• |
Version: The version of the agent. |
|
• |
Upgradeable: If a more recent version of the agent package is deployed to the host, the agent can be upgraded. This column indicates if an upgrade exists for the agent instance. |
|
• |
Log File: Click to obtain a copy of the agent log file.For more information, see Retrieve agent logs. |
|
• |
Target Host: Displays the host that is being monitored by the agent instance. When there are multiple hosts being monitored by the agent instance, this column displays the major host or becomes blank. |
|
• |
Last Data Submission: Displays the date and time when the agent instance submits the data the last time. |
|
• |
Refresh: Refreshes the Tasks table to reflect the current status of any running or completed tasks. |
|
• |
Clean Completed Tasks: Removes any completed tasks from the table. |
|
• |
Status: The task status. |
|
• |
Action: The action performed by the tasks. |
|
• |
Details: Any details related to the task. |
|
• |
Host Name: The name of the host on which the task is running. |
|
• |
Status Message: A message associated with the task status. |
|
• |
Duration Time: The amount of time needed to complete the task. |
Two additional columns are hidden by default. You can display them using the Customizer :
|
• |
Start Time: The time when the task started. |
|
• |
End Time: The time when the task ended. |
An administrator uses services to help organize the monitoring environment. The Agent Status dashboard allows you to filter and display the agents that capture data about the monitored objects in the selected service(s). This option helps you better monitor the agent, like checking the agent status, stopping data collection and so on.
|
1 |
|
2 |
|
4 |
Click Close. |