If you are just getting started with the Nova Report Center, you may be unsure of some of the words and phrases that you encounter. Below are some common words and phrases related to Nova Report Center, along with descriptions.
It is important to differentiate what is meant between a section of a report and the report itself.
·A Section of a report are the individual charts, graphs and tables themselves. You can have one or multiple sections in a report.
·A Report is where individual data sections can be created, modified and stored.
Data sources
Data sources drive reports. They are the sets of information used to build reports. Choose a data source that is representative of the type of data you want to display. If you can not decide on a data source, you can clone one of the system reports to get started. To see more on data sources, click here.
Organization
You can narrow the scope of your report to a specific organization within your tenant.
Organization Group
Select an organization group to further narrow the scope within your report.
Add Aggregation
For table reports, you can aggregate fields to get a specific count for that field. For example, let us say you want to quickly see how many Microsoft Entra ID users have been assigned to each department within your organization. You can do this by selecting Department as your table field, then select Add aggregation, then choose Display Name with Count as your operator. The amount of users within each department displays. This is useful if you need to know the number of objects within a data field.
Add Filter and Add Sorting
Filters and sorting are explained above. Note that you can use up to 5 filters within each section of your report. To learn more about filtering, click here.
Offset
Set the starting record by applying an offset.
Limit
This is the highest number of results shown within the report. For example, if you have a limit of 20, then 20 entries display. Note that if you choose to download your report, the limit will be ignored and all data is shown.
Enable Paging
Useful for large data sets, paging allows you to see a select number of results per page before you need to move to the next page for more results. If this is disabled, all data displays in one table without having to page through results. If the report is downloaded, it will not be organized into pages.
Overflow
It is likely that your pie/bar chart will have a lot of data to show, resulting in a complex report that's not easy to analyze. Overflow aggregates calculations outside of your limit into one specific bar or pie wedge. For example, if you have a limit of 6 wedges or bars, any data from outside of your 6 biggest wedges or bars will be calculated and formed into one bar or wedge.
Nova reports can be customized and organized.
Customizing reports
There are several ways to customize reports so they are specific to your organization. You can customize a report's sections and layout. You can customize the data source and fields used in each section. And, you can customize how information displays in each section by applying sorting and filters.
Searching reports
You can search for reports based on the title or description.
Cloning reports
You can clone any of the reports. After you give the new report a unique name, you can customize the new report by adding/removing sections, fields, and sorts/filters, so the new reports show exactly what you want to see.
Sharing reports across the organization
Organizing your organization's reports is easy, too. For example, you can share reports with the other Nova users from your organization.
Scheduling reports
You can schedule reports to be sent one time or periodically to stakeholders.
Importing and exporting report definitions
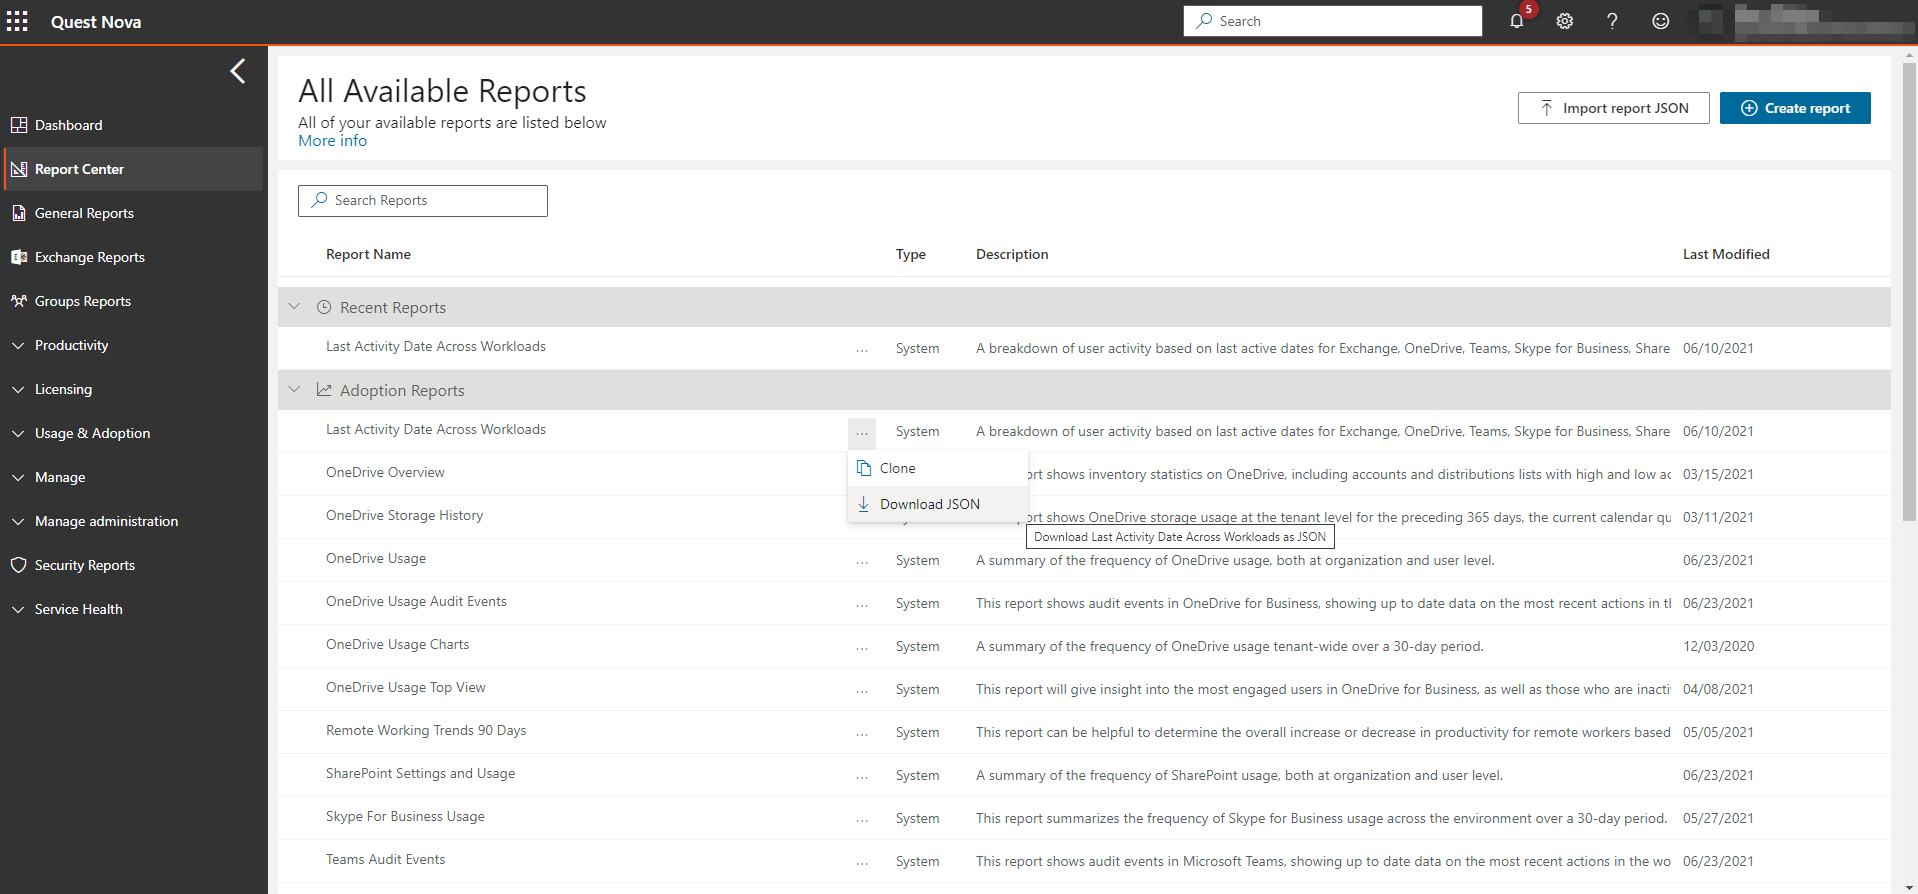
And, you can download a report definition, storing it for safe keeping. This is helpful in case the report definition gets edited by someone in your organization and you want to restore a previous version of the report. Here is how you can download a report definition:
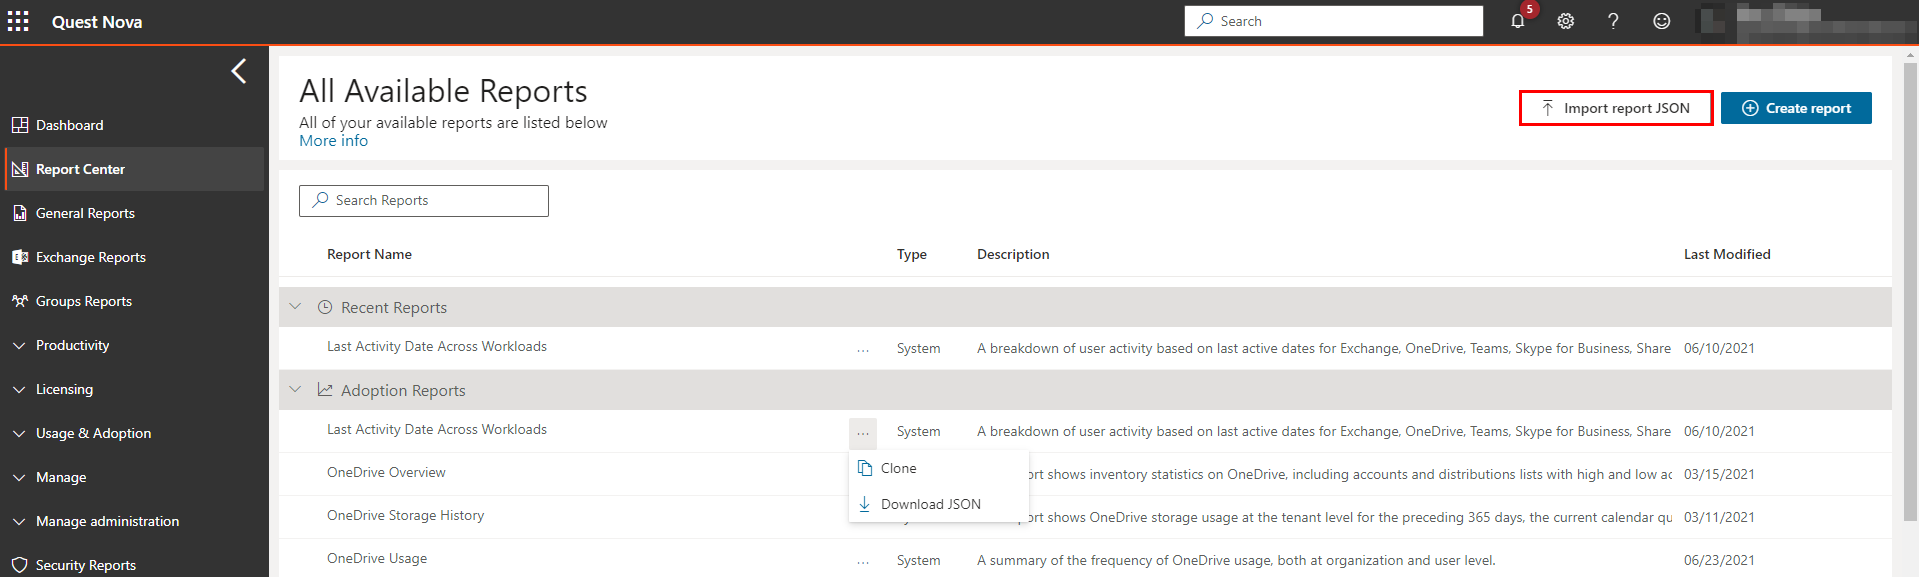
And, here is how you import a report definition:
Here is an overview of the steps you will follow to create a new report.
1.Select the Report Center option from the left menu bar.
2.Click Create Report, which is located in the top right corner of the page.
3.Enter a report name in the text field.
4.Click the + sign in the empty section to add a new section to the report.
5.Give the section a name in the Add Title field, and add a description if necessary, and select the tick icon to save the title and description.
6.Choose how you would like your data to be presented; choose between a chart, graph, table, timeline, or map. Find more on data presentation types in the following sections.
7.Choose a data source, depending on the information you would like to present.
8.If necessary, choose an organization and organization group.
From this point, the steps vary dependent on your choice of presentation type.
Charts and pivots give you a great range of graphs to view a variety of data across your tenant. Charts and pivots also give you access to view the many data sources Nova has on offer in easy to analyze diagrams.
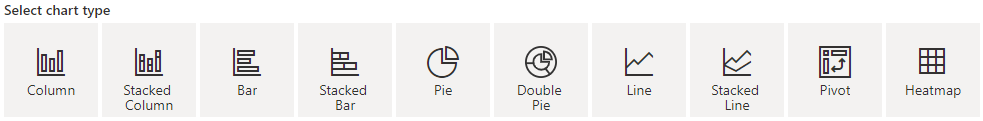
9.Select your chart type. This includes the following types:
10. Choose your operator (average, count, sum, min, max).
11.Choose your Applied to field. This represents your Y axis.
12. Choose your Series name. This is your X axis.
13. Optionally, choose your category. This is additional information with your X axis.
14. If applicable, add sorting and filters.
15. Add an offset and a limit.
a.An Offset is the starting record for the section.
b.The Limit is the number of records returned and visible within the report.
|
|
NOTE: When downloading a section, this limit is ignored. |
16. Choose whether you would like the Overflow option. Setting an overflow will gather objects outside of a specific range into its only section.
17. Optionally, choose whether to drill down data fields. These can be fields you have selected for your section, or other fields within the data source.
|
|
NOTE: You have the option to view the raw data in your chart. |
You can now save your chart, and close the section.
Custom chart example: Microsoft Entra ID users by location
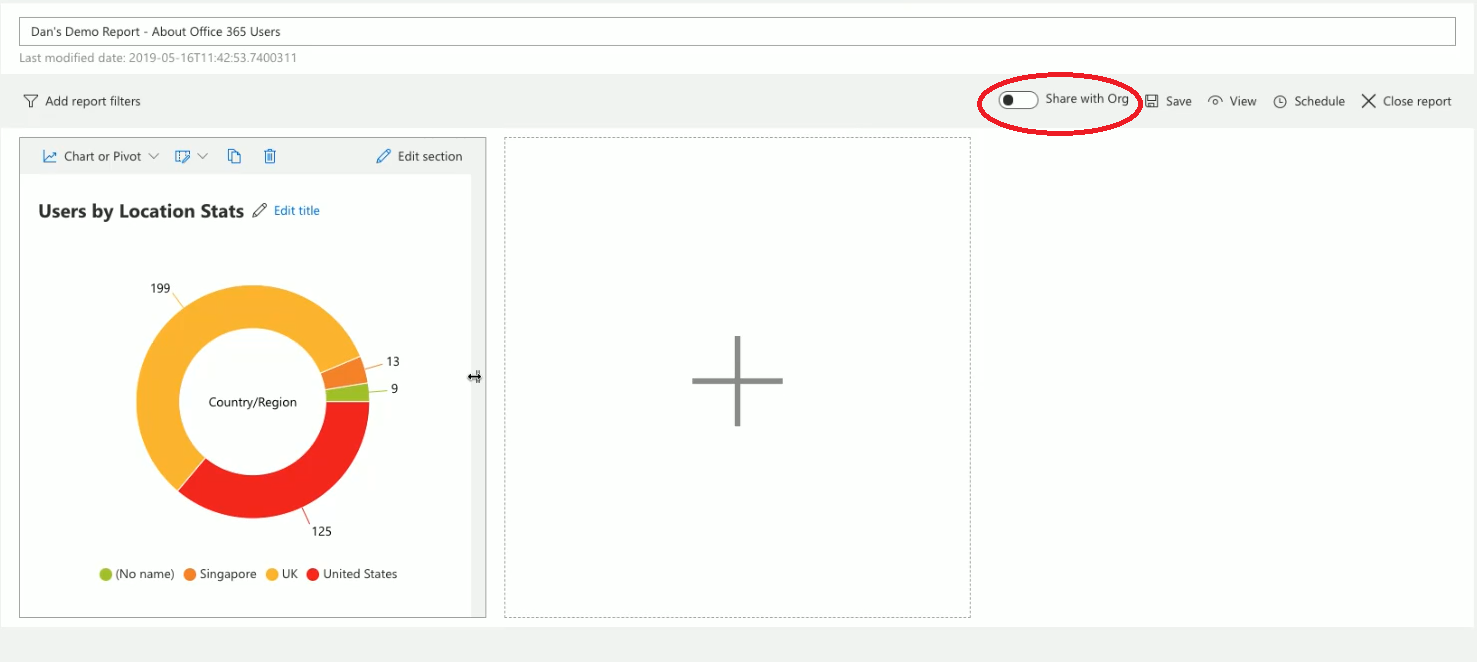
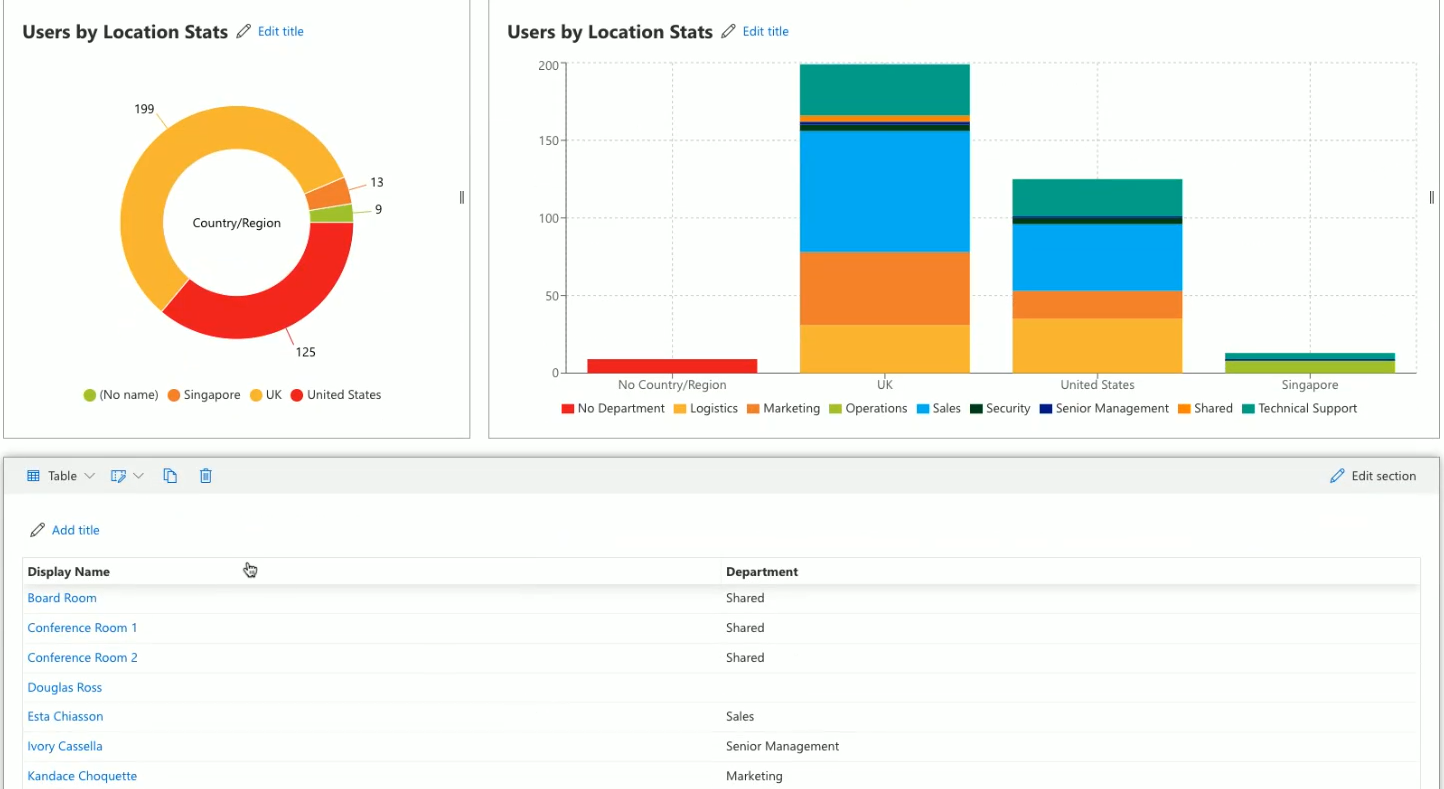
You can create an Microsoft Entra ID Users by Location report. The report shows your organization's Microsoft Entra ID users, broken down by location and department. This report could be helpful for planning helpdesk resources/staffing/coverage. The report includes a pie chart with the Microsoft Entra ID Users data source. The report's second section is a stacked bar graph with the Microsoft Entra ID Users data source. Finally, the report contains a table which shows users' display names, country/region and departments. Here is how the finished report looks:
Here are the steps to create this report:
1.Click Create Report.
2.Enter a report title, for example Microsoft Entra ID Users by Location.
3.You will add 3 sections to this report using the steps below:
Section One: Users by Location Stats
|
1.Add a section title, for example Users by Location Stats, and a description if necessary. 2.Choose the Entra ID Users data source under the User Data data source category. 3.Select the Pie chart type. 4.In the Operator field select count. 5.In the Applied to field select Display Name. 6.In the Series name field select Country/Region. 7.Save and close the section. |
Section 2: Users by Location and Department
|
1.Add a section title, for example Users by Location Stats, and a description if necessary. 2.Choose the Entra ID Users data source. 3.Select the Stacked Column chart type. 4.In the Operator field select count. 5.In the Applied to field select Country/Region. 6.In the Series name field select Country/Region. 7.In the Category field select Department. 8.Click Close section. |
Section 3: List of Users by Department
|
Find this section in the tables section of this guide. |
After you are done adding sections, click Save.
Here is a video going through these steps.
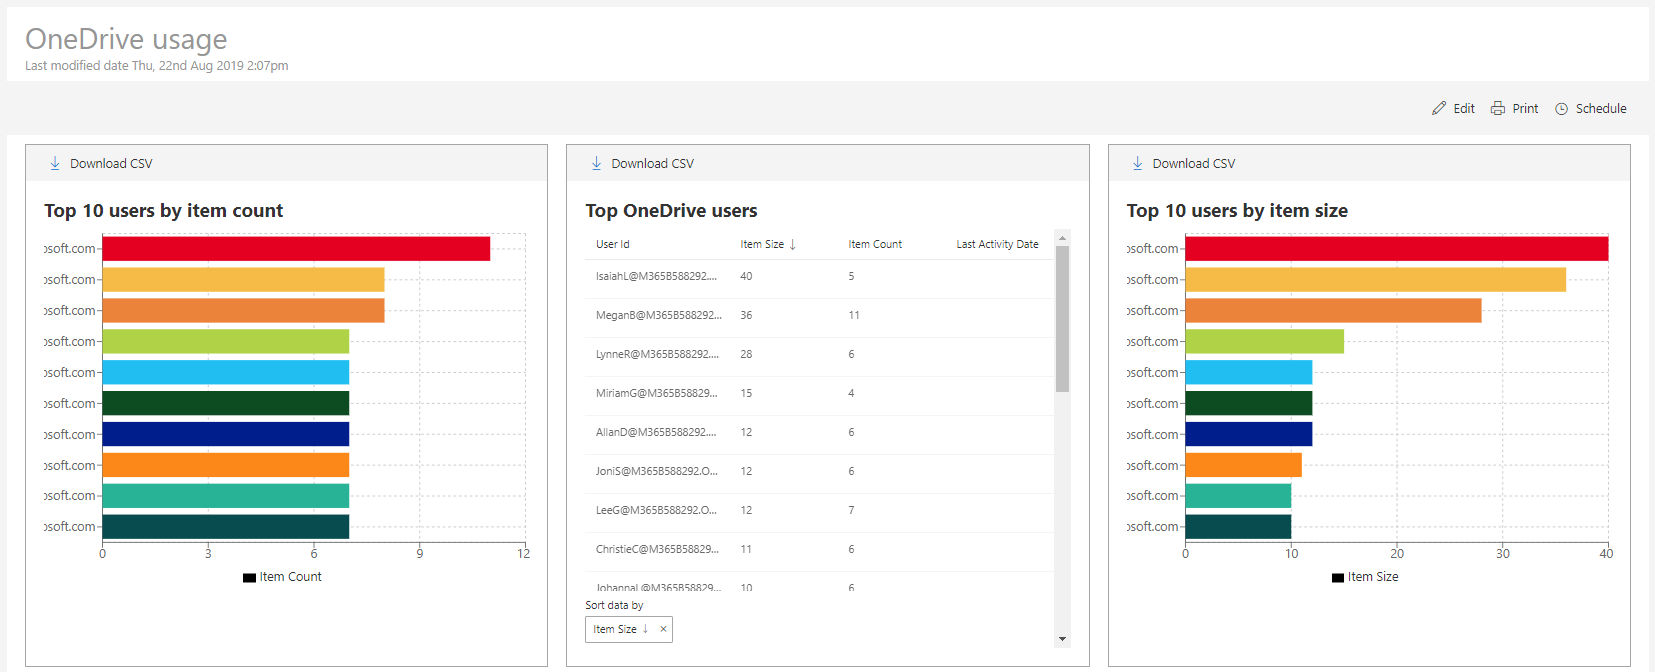
Custom chart example: OneDrive usage
You can create a OneDrive Usage report. The report shows:
·which of your users are using OneDrive for Business most (the most items and the largest items)
·vertical line bar graph with OneDrive User Data as the data source, sorted by item count (listed by user ID)
·a table that also uses OneDrive User Data as the data source. This table is sorted by item size.
·a vertical line bar graph with OneDrive User Data as the data source. This table is filtered by item size (results in this graph also listed by user ID).
Here is how the finished report looks:
Here are the steps to create this report:
1.From the dashboard, click Create Report.
2.Enter a report title, for example OneDrive Usage.
3.You will add 3 sections to this report using the steps below:
Section One: Top 10 Users by Item Count
|
1.Add a section title, for example Top 10 Users by Item Count. 2.Choose the OneDrive User Statistics data source under OneDrive Data. 3.Choose an organization and group, if applicable. 4.Select the Column chart type. 5.Under the Operator section, select Sum. 6.Under the Applied to section, click Select field..., and select Item Count. 7.Under the Choose series name field, click Select field..., and select User Id. 8.Click Add sorting, then Select field..., and select Item Count. Sort in descending order. 9.Under the Offset text field, put 0. 10.Under the Limit text field, put 10. 11.Un-check the Overflow button. 12.Save and close the section. |
|
1.Add a section title, for example Top OneDrive Users. 2.Choose the OneDrive User Statistics data source. 3.Choose and organization and group, if applicable. 4.Click Select field..., and select User ID, Item Size, Item Count, and Last Activity Date in this order, and then close the dialog. 5.If desired, drag and drop the columns, to re-order them. 6.Click the Add sorting link, click Select field..., and then select Item Size. 7.If required, you can limit the amount of users in this table. Under the Limit text field, choose how many users you want in this table by changing the number. 8.Save and close the section. |
Section 3: Top 10 Users by Item Size
|
1.Add a section title, for example Top 10 Users by Item Count. 2.Choose the OneDrive User Statistics data source under OneDrive Data. 3.Choose an organization and group, if applicable. 4.Select the Column chart type. 5.Under the Operator section, select Sum. 6.Under the Applied to section, click Select field..., and select Item Size. 7.Under the Series name section, click Select field..., and select User ID. 8.Click the Add sorting link, click Select field..., and select Item Size. 9.Sort in descending order. 10.Under the Offset text field, put 0. 11.Under the Limit text field, put 10. 12.Un-check the Overflow button 13.Save and close the section. |
After you are done adding sections, click Save.
Watch this video to see the above steps in action.
Custom chart example: License utilization
Here is another example of creating a report in the Nova Report Center.
Creating a report using License data sources allow you to get a scope of your license utilization within your tenant. This includes
·Assigned units licenses applied to users
·Unassigned units licenses not applied to users
·Idle units licenses applied to users but are not being used i.e. disabled/deleted users
See below to view the steps on how to create a chart section on your license usage.
|
Click Create Report. 1.Enter a report title, for example License Utilization. 2.Click the plus sign to add a section to the report, and a description if desired. 3.Add a title and description for your section. 4.Choose the Tenant License History data source under the License Data data source category. 5.Click column. 6.Under operator. choose Average. 7.Under Applied to, choose Percentage of Consumed Units. 8.Under Series name, choose License Name. 9.Set your offset and limits if necessary. 10.Save, then close the section. |
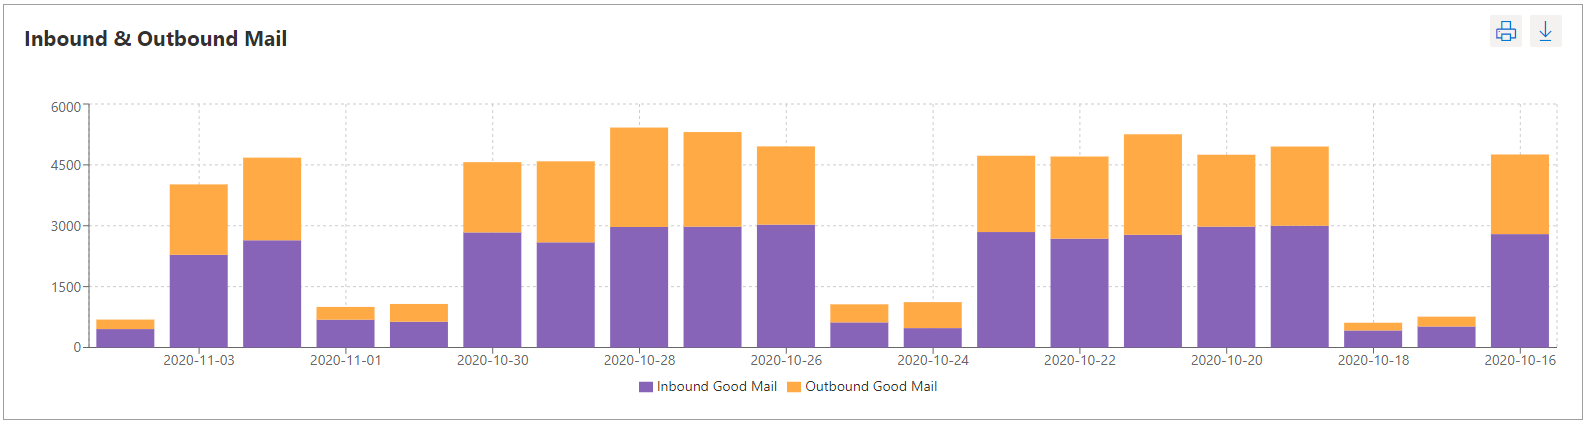
Custom chart example: Stacked inbound/outbound mail chart
Creating stacked graphs allows you to view multiple data fields in one easy to analyze chart. For example, in the chart below, we will create a stacked bar graph that shows the sum of inbound mail and outbound mail in one chart.
To begin creating your stacked chart:
|
1.Create a new section and give your chart a name. 2.Choose the Office 365 Mail Traffic data source under Exchange Data. 3.Choose Stacked Column. You can also select Stacked Bar or Stacked Line if you prefer. 4.For your operator, choose Sum. 5.For Applied to, choose Inbound Good Mail and Outbound Good Mail. 6.For Series Name, select Scan Date. 7.Add sorting, then select Scan Date. Choose descending from the drop down list. 8.Input your Offset and Limit. These are the amount of dates that appear in your chart. |
The data should now appear within your section. Click close section, then save. This chart can download as a PDF, if desired.