Converse agora com nosso suporte
Chat com o suporte

Foglight for Infrastructure 5.9.2 - User Guide

Using Foglight for Infrastructure Monitoring log files with Foglight Log Monitor Monitoring IBM PowerVM environments
Before you begin Managing PowerVM HMC agents Monitoring your PowerVM environment
Advanced system configuration and troubleshooting Reference
Advanced System Configuration Foglight for Infrastructure views Foglight Log Monitor views Rules Metrics
Appendix: Building regular expressions in Foglight

Exploring managed server profiles

The Server Profile tab appearing on the managed server view displays system configuration information about the selected managed server. Use it to find out the overall capacity of the physical system hosting multiple logical partitions.

To navigate to this tab, in the Selected Service PowerVM view, select a managed server, and click Explore.

Figure 28. Server Profile tab

The managed server model number.

The managed server serial number.

The primary IP address of the managed server in your monitored environment.

The secondary IP address of the managed server.

The remaining number of world wide port names (WWPNs).

The number of processor units allocated to the managed server.

The number of processor units that can be allocated to the shared processor pool and reallocated to PowerVM partitions associated with the managed server.

The number of processor units that cannot be allocated to the shared processor pool.

The maximum number of shared processor pools associated with the managed server.

The maximum number of shared processor units allocated to each PowerVM partition associated with the managed server.

The maximum number of processor units allocated to each PowerVM partition associated with the managed server.

The amount of system memory allocated to this managed server.

The portion of system memory that can be allocated to the shared memory pool and reallocated to PowerVM partitions associated with the managed server.

The portion of system memory that cannot be allocated to the shared memory pool.

Investigating the use of PowerVM partition and VIOS processor resources

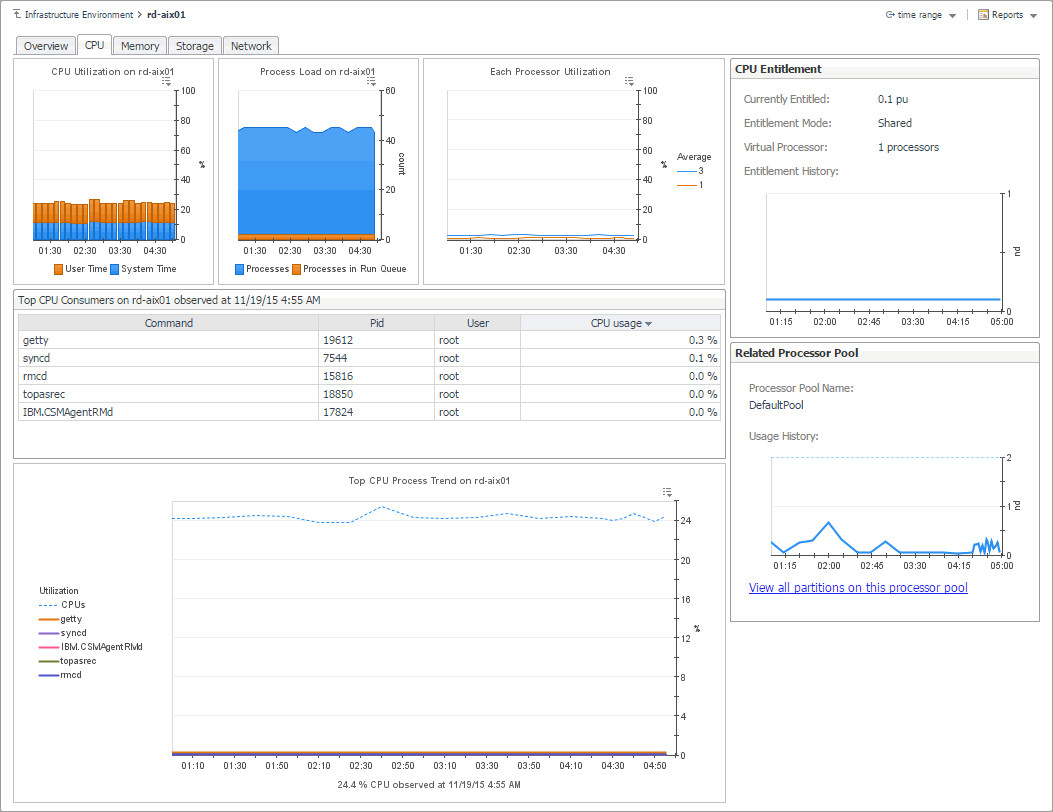
The CPU tab of the Partition detail view or VIOS detail view shows the amount of processor resources dedicated to the selected object and their entitlement mode. It also shows the top processor consumers on the host, the top processes’ utilization trends, and illustrates the processor load.

To navigate to this tab, in the Selected Service PowerVM view, select a PowerVM® partition or a VIOS, click Explore, and in the view that appears, open the CPU tab.

Figure 29. CPU tab

Table 11. CPU tab

CPU Entitlement


Currently Entitled

The number of processing units allocated to this PowerVM partition or VIOS.


Entitlement Mode

Indicates if the processor resources allocated to PowerVM partition or VIOS can be allocated to the shared processor pool and reallocated to other PowerVM partitions or virtual I/O servers.


Virtual Process

The number of processors allocated to the virtual process associated with this PowerVM partition or VIOS.


Entitlement History

The number of processing units allocated to this PowerVM partition or VIOS over the selected time range.

Related Processor Pool


Processor Pool Name

The name of the processor pool associated with this PowerVM partition or VIOS.


Usage History

The number of processing units allocated to this processor pool that are used over the selected time range.

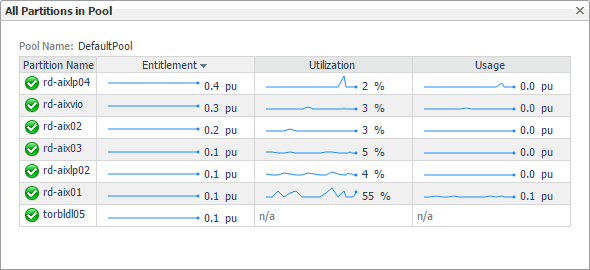
View all partitions on this processor pool

Clicking this link displays the All Partitions in Pool dialog box that lists all PowerVM partitions that use this processor pool, their entitlement, utilization, and usage.

Investigating the use of PowerVM partition and VIOS memory resources

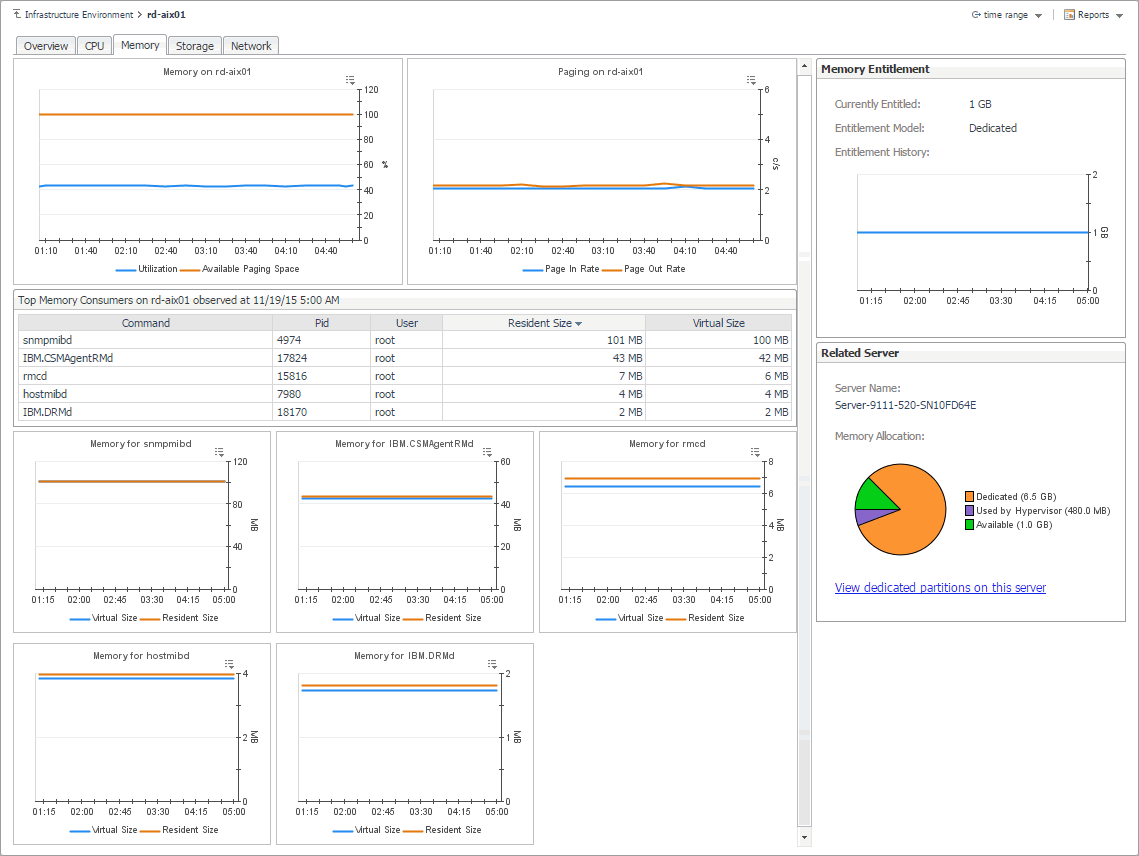
The Memory tab of the Partition detail view or VIOS detail view shows the amount of memory resources dedicated to the selected PowerVM® partition or PowerVM VIOS, their entitlement model, and identifies the managed server on which the partition is running. It also shows the overall memory utilization on the selected partition and the amount of memory the top processes are consuming. The Top Memory Consumers table lists both resident and virtual sizes for the top processes.

To navigate to this tab, in the Selected Service PowerVM view, select a PowerVM partition or PowerVM VIOS, click Explore, and in the view that appears, open Memory tab.

Figure 30. Memory tab

Table 12. Memory tab

Memory Entitlement


Currently Entitled

The amount of memory allocated to this PowerVM partition or VIOS.


Entitlement Model

Indicates if the memory resources allocated to PowerVM partition or VIOS can be allocated to the shared memory pool and reallocated to other PowerVM partitions or virtual I/O servers.


Entitlement History

The amount of memory allocated to this PowerVM partition or VIOS over the selected time range.

Related Server


Server Name

The name of the PowerVM server this PowerVM partition or VIOS belongs to.


Memory Allocation


Dedicated

The amount of memory that is allocated to the PowerVM server this PowerVM partition or VIOS belongs to, and is currently in use by the associated PowerVM partitions.


Hypervisor Used

The amount of memory that is allocated to the PowerVM server this PowerVM partition or VIOS belongs to, and is currently in use by the PowerVM Hypervisor software layer.


Available

The amount of memory that is allocated to the PowerVM server this PowerVM partition or VIOS belongs to, and is available for use.


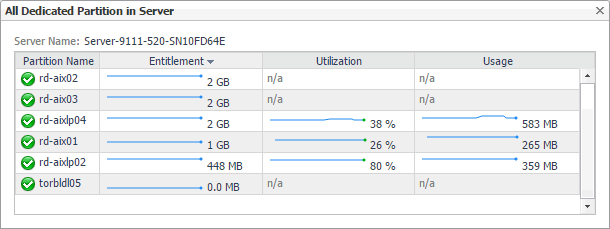
View dedicated partitions on this server

Click this link to display the All Dedicated Partitions in Server dialog box that lists all dedicated PowerVM partitions that belong to this PowerVM server, their entitlement, utilization, and usage.

Exploring processor, memory, and storage breakdowns

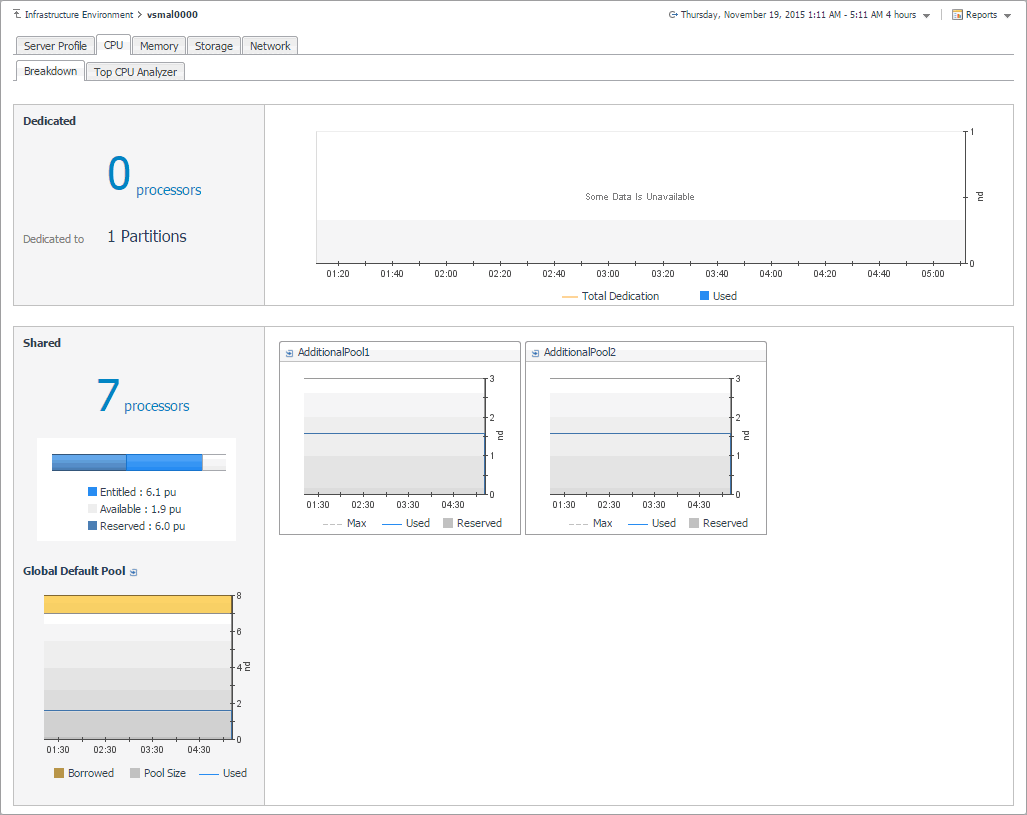
The Breakdown views on the CPU, Memory, and Storage tabs of the managed server details view, and on the Storage tab of the VIOS details view show the amount of processor, memory, and storage resources the selected managed server or PowerVM® VIOS uses from the Global Default Pool over the selected time range. Use this view to find out how the selected object uses the allocated resources, and if there are any patterns indicating their usage levels that may potentially compromise the stability of your infrastructure.

To navigate to this tab, in the Selected Service PowerVM view, select a managed server, or a PowerVM VIOS, and click Explore. Open the CPU (PowerVM servers only), Memory (PowerVM servers only), or Storage tab, and then open the Breakdown tab.

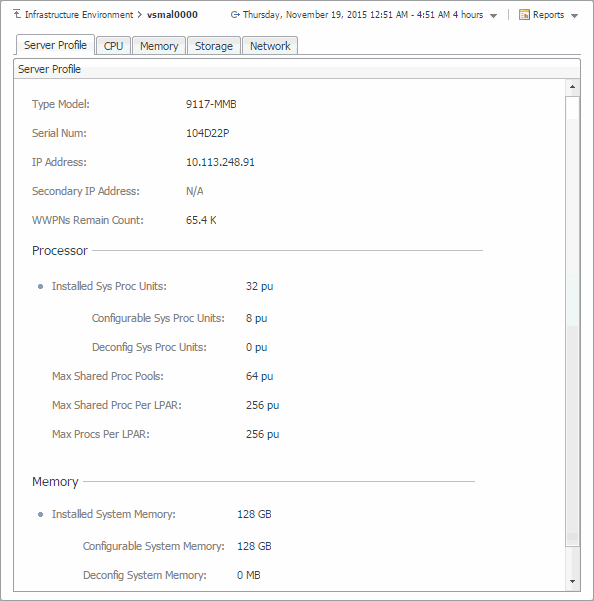
Figure 31. Breakdown tab

Table 13. Breakdown tab

Information about the processor dedicated to the PowerVM partitions that are running on the selected managed server.

The number of processing units shard among the PowerVM partitions that are running on the selected managed server.

The number of processing units that are allocated to the PowerVM partitions that are running on the selected managed server.

The number of processing units that are available for allocation to the PowerVM partitions that are running on the managed server.

The number of processing units that are reserved by the Shared Processor Pool associated with the selected managed server.


The total number of processing units that are borrowed from donating PowerVM partitions and of all processing units.

The total number of processing units contributed to the global default pool, over the selected time range.

The number of processing units contributed to the global default pool that are in use by the associated PowerVM partitions, over the selected time range.


The highest number of processing units allocated to the additional pool, over the selected time range.

The number of processing units allocated to the additional pool that are in use, over the selected time range.

The number of processing units allocated to the additional pool that are reserved, over the selected time range.

The amount of memory that is allocated specifically to the partitions running on the managed server, and not participating in shared memory pools.

The number of partitions to which the managed server allocates memory resources that do not participate in shared memory pools.

The total amount of memory that is allocated specifically to the partitions running on the managed server, and not participating in shared memory pools, over the selected time range.

The amount of memory that is allocated specifically to the partitions running on the managed server, and used by those partitions, over the selected time range.

Information about the memory resources that the managed server allocates to the shared memory pool.

Information about the disk volume that is not allocated to the partitions running on the managed server or PowerVM VIOS.

Information about disk volumes that are dedicated and in use.

Physical Volume

The number of physical disks that are used to create volume-based pools.

Volume Based Pools

The number of volume-based pools associated with the selected managed server or PowerVM VIOS.

The amount of disk space that is allocated and used by to the PowerVM partitions running on the managed server, over the selected time range.

The total size of the volume-based pool.

Documentos relacionados

The document was helpful.

Selecione a classificação

I easily found the information I needed.

Selecione a classificação