Diagnostic Tests dashboard
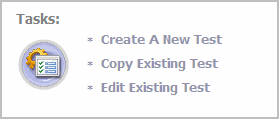
Tasks list
|
• |
Create a New Test - select this task to specify the test parameters to be used to run a test. Selecting this task launches the Create New Diagnostic Test wizard which steps you through the process. |
|
• |
Copy Existing Test - select this task to use an existing test as a basis for creating a new test. Selecting this task displays the Copy Diagnostic Test dialog allowing you to select an existing test to be copied. Once you select a test to be copied, the Create New Diagnostic Test wizard is launched allowing you to modify the test parameters as required. |
|
• |
Edit Existing Test - select this task to modify the test parameters of an existing test. Selecting this task displays the Edit Diagnostic Test dialog allowing you to select an existing test to be modified. After selecting the test to be edited, the Edit Diagnostic Test wizard is launched allowing you to modify the test as required. |
|
1 |
Select the Create a New Test task in the task list at the top of the dashboard to launch the Create New Diagnostic Test wizard. |
|
3 |
On the Test Targets page, select the Select Targets button. On the Select Targets dialog, select one or more servers and select OK. |
|
• |
Run Once - select to run the test one time when the Finish button is selected. |
|
• |
Run Periodically - select to run the test multiple times during a day. Enter how often the test is to be run (every nn minutes). To specify a start and end time, select the Use execution window check box and use the calendar controls to specify the start and end time. |
|
• |
Run Once Each Day - select to run the test every day at the specified time. Use the calendar control to specify the time. |
|
5 |
Select Finish to initiate the test run and close the wizard. |
|
1 |
Select the Copy Existing Test task in the task list. |
|
• |
On the second page, select the Select Servers button to select the servers on which the test is to be run. |
|
4 |
Select Finish to save your selections and close the wizard. |
|
1 |
Select the Edit Existing Test task in the task list. |
|
2 |
Select the test to be modified from the Edit Diagnostic Test dialog and select Edit to launch the Edit Diagnostic Test wizard. |
|
4 |
When complete, select the Finish button to save your selections and close the wizard. |
The Create New Diagnostic Test wizard includes several pages and requires the following information:
|
• |
Execution Timeout (seconds) - By default, the execution timeout is set to 15 seconds. To change this setting, enter a different value. |
|
• |
Destination Email Address - When the External Mailbox test type of selected, enter the email address of the external mailbox to be tested. |
|
• |
Test Targets: From this page, select the target servers on which the test is be run. |
|
• |
Test Execution Schedule: From this page, specify how often the test is to be run. |
|
• |
Run every nn minutes - enter the number of minutes |
|
• |
Use execution window - select this check box and use the calendar controls to specify the start and end time. |
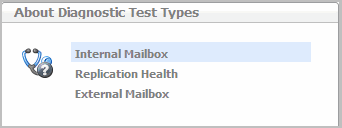
About Diagnostic Test Types pane
Diagnostic Tests list
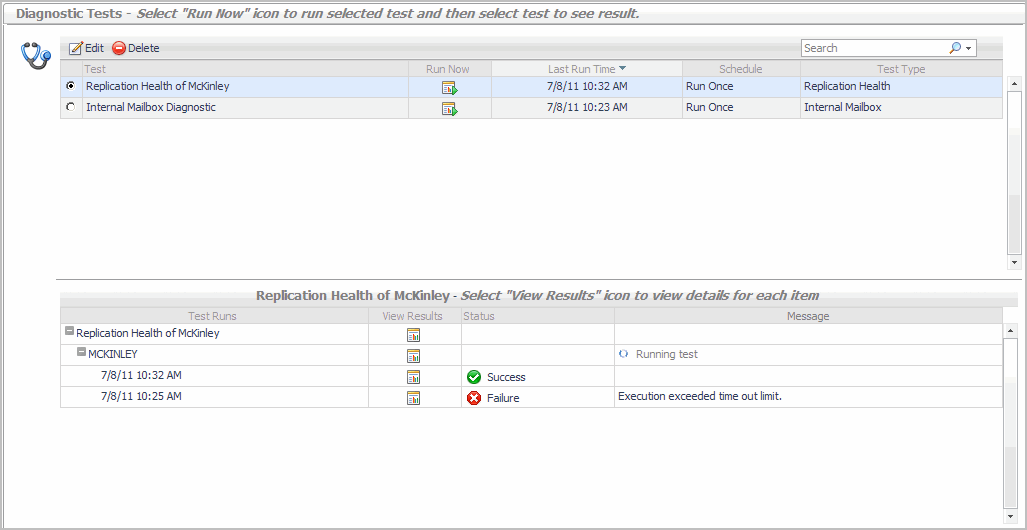
The remainder of this dashboard consists of the Diagnostic Tests list. As tests are created using the Create New Diagnostic Test wizard, the test parameters specified in the wizard will be displayed for each new test created. From this list, you can select the Run Now icon to run the test or select a test to view the test results.
|
Select the selection icon for a test to display an additional panel at the bottom of the page to display the results of the selected test. See Test results for a description of the additional details displayed. Selecting a test also enables the Edit and Delete toolbar buttons allowing you to remove the test from the list or edit the test to be run. | |
|
Displays the name of the test as entered on the first page of the wizard. | |
|
Click the NOTE: If agent data collection is turned off for the selected target server, the test will fail. If you start the data collection for the server and run the test within the 10 minute interval, the Test Run Frequency Warning message appears. Use the Overrule button to run the test now that the agent data collection is turned on. | |
|
Displays the test execution schedule as specified in the wizard. | |
|
The name of the selected test is displayed across the top of this pane. | |
|
Click the | |


