Converse agora com nosso suporte
Chat com o suporte

Foglight APM for Real User Experience 5.9.9 - User Guide

Getting started with Foglight APM Monitoring transactions Viewing real user activity from a geographical perspective Assessing real user experiences during key sequences Monitoring the performance of web sites and endpoints Searching APM data Replaying sessions, hits, and sequences Visualizing search results Creating custom drag-and-drop dashboards APM tile and view reference

Real User (APM) Performance detail view

To access this view, click the title bar of a Real User (APM) tile, or from the Geographical Perspectives dashboard, click Transaction Detail for an APM transaction.

Hits and Pages tabs

Click Find Related Hits to open the Search Hits page.
Click Advanced Find to open a list from which you can select a specific type of search. Choose from hits with: back end violations, end to end violations, or errors. The Hit Search runs with your selected criteria. Any results are returned on the Search Hits page.

Response Time Breakdown tab

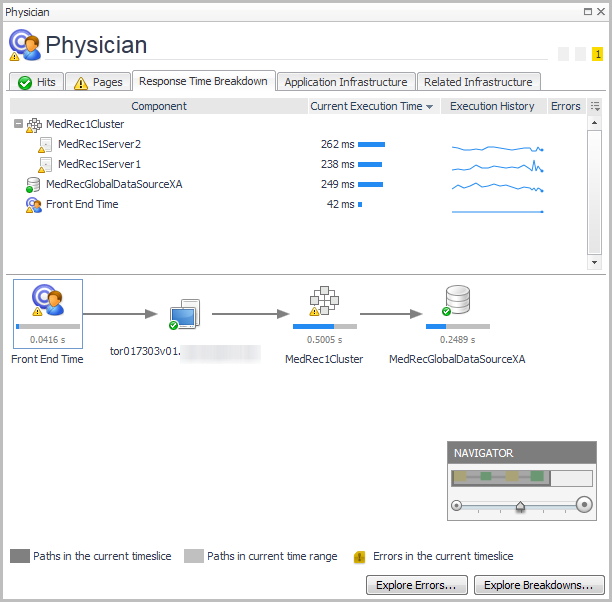
Click Explore Errors .
Click Explore Breakdowns .
Click More Details to drill down to a detailed view of the selected application component. For example, from an application server component, you can access the Java application server details view.

Application Infrastructure tab

Documentos relacionados

The document was helpful.

Selecione a classificação

I easily found the information I needed.

Selecione a classificação