Converse agora com nosso suporte
Chat com o suporte

Benchmark Factory for Database 9.0 - User Guide

Welcome to Benchmark Factory What's New in Benchmark Factory Additional Resources Overview of Benchmark Factory Benchmark Factory Components Licensing Getting Started - the Benchmark Factory Workflow Agents Create and Edit Connections Create and Edit Tests and Jobs
Jobs View Pane Job Wizards Quickstart: Create a New Job Edit a Job Industry Standard Benchmark Tests Capture and Replay a Workload Artificial Test for Desired Effect Scalability Tests Custom Tests Create/Delete Benchmark Objects Execute External File Test Options for Create Objects Test Options for Transactions Job Setup Options Use Global Search/Replace Save Job as BMF Script Copy Test to Replay, Mix, Goal, or Scalability Test
Benchmarks How Do I... Settings Test Results and Run Reports BFScripts Repository Troubleshooting The Benchmark Factory REST API Appendix About Us Adding Virtual Users System/Upgrade Requirements/Supported Databases Shortcut Keys

Run Reports Viewer

Open the Run Reports viewer to view a list of all test result reports.

To open Run Reports
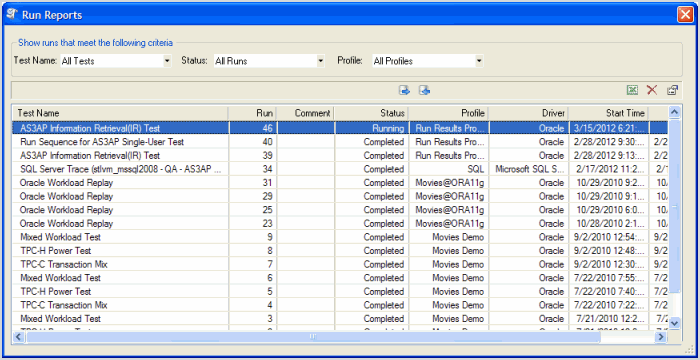
  1. From the Benchmark Factory console click Tools | Run Reports. The Run Reports viewer opens.

See Using Benchmark Factory Run Reports for more information.

Importing and Exporting Benchmark Factory Test Results from Run Reports

From Run Reports, you can import or export run results.

To import or export testing results:
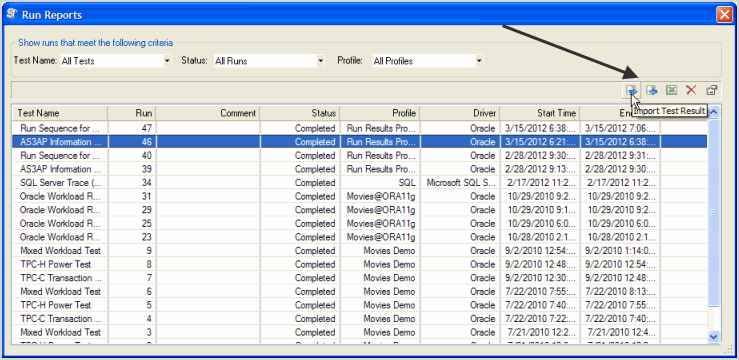
  1. Open Run Reports.
  2. Click on the required Import or Export button.

Navigate to the required folder to import or export the test results.

  1. Click Open or Save.


Using Benchmark Factory Run Reports

Benchmark Factory Run Reports  provides a wide array of graphs, charts, and data that allow you to a analyze load testing scripts.
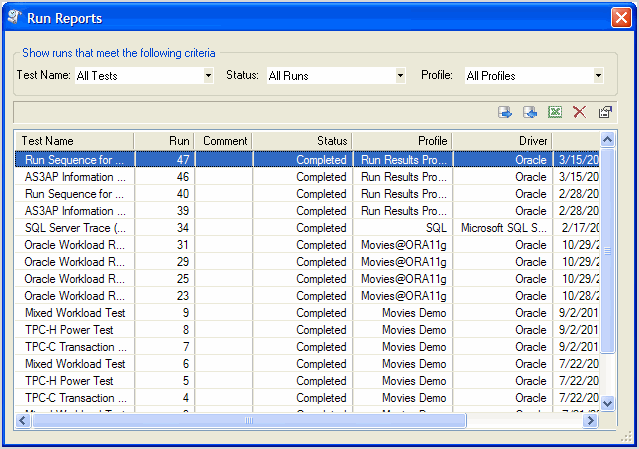
Navigating in Benchmark Factory Run Reports

To open a test, double-click on the test name, or select the test name and click the Show Test Results icon in the upper right corner of the dialog.
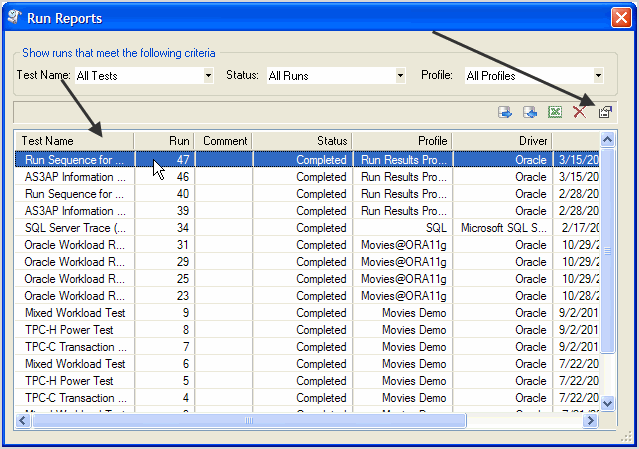
When Benchmark Factory Run Reports opens, the Results Summary displays. Click Go Back to return to the previous screen.

To navigate Benchmark Factory Run Results

  1. Select a section of the report to view, for example, Testbed.

  1. Click Details. The Testbed information displays.

  1. To navigate back to Results Summary, click Go Back in the upper-left corner.

Run Reports provides the following views:

Results Summary

The Results Summary provides graphs and user load statistics for the selected test. The following graphs and tables are provided:

Results Summary Graph

Note: Not all tests provide the Results Summary graph.

This is a customizable graph that allows you to view selected data points.
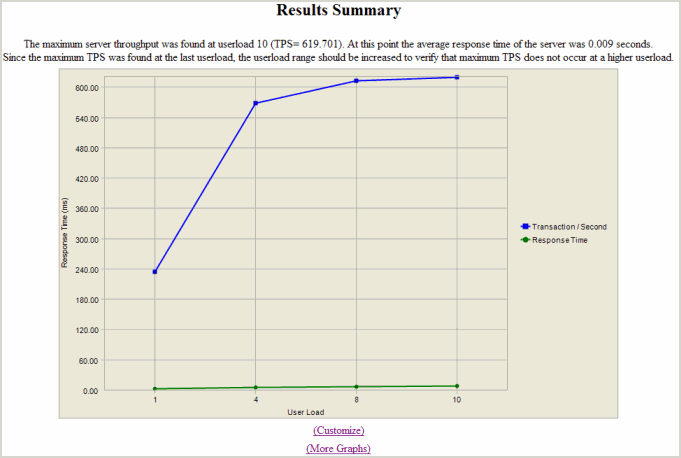
To add or remove datapoints to the Results Summary graph

  1. In the lower section of the graph, click Customize.
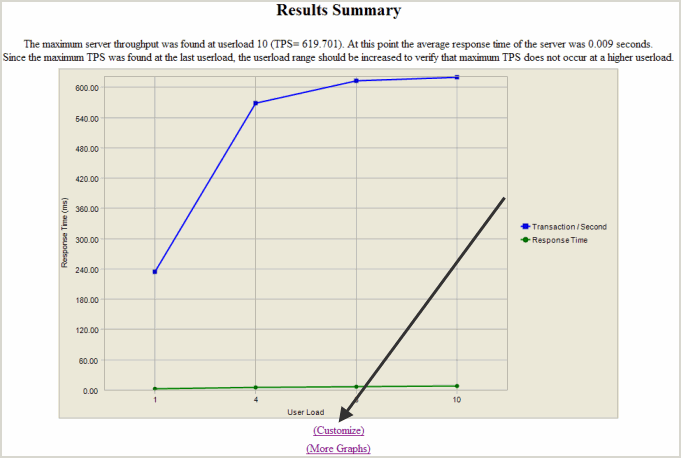
  2. In the upper left corner, click Click here to Add Datapoints.
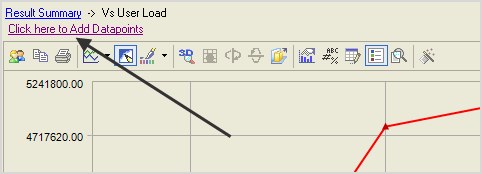
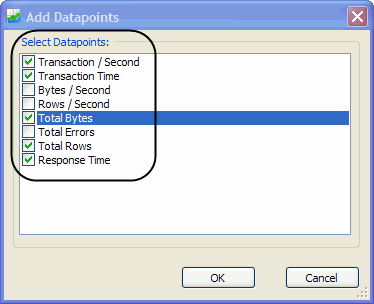
    The Add Datapoints dialog displays.

  3. Select the required datapoints.

  4. Click Ok.

    The selected datapoints display.
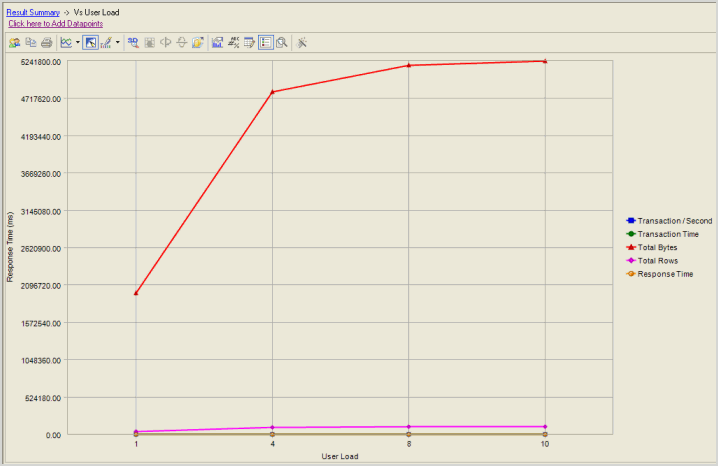
Other Results Summary Graphs

The Results Summary view allows you to view other graphs that provide test details.

To view other Results Summary Graphs
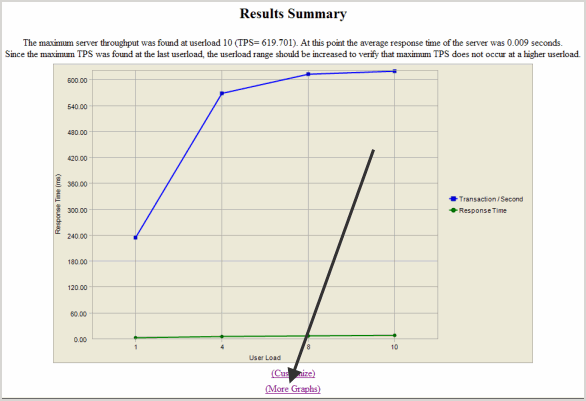
  1. In the Results Summary view, click More Graphs.

The following graphs display:

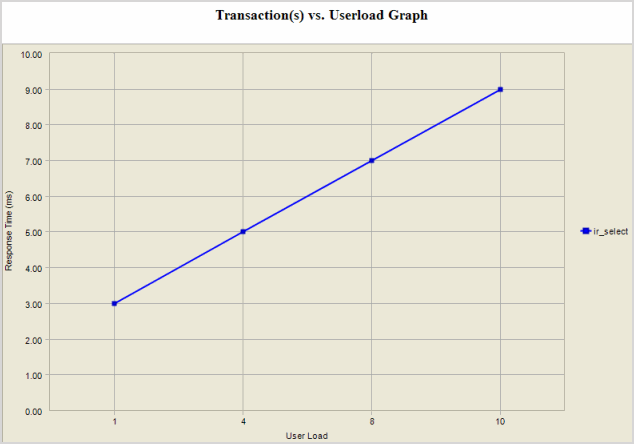
Userload

Understanding how user loads affect the performance of a database is essential to end user satisfaction. The Userload graph plots user load against:

  • Response Time
  • Total Bytes
  • Total Errors
  • Total Rows
  • Response Time

Reviewing these datapoints allows you to fully understand how "real-world" userloads affect database performance.  
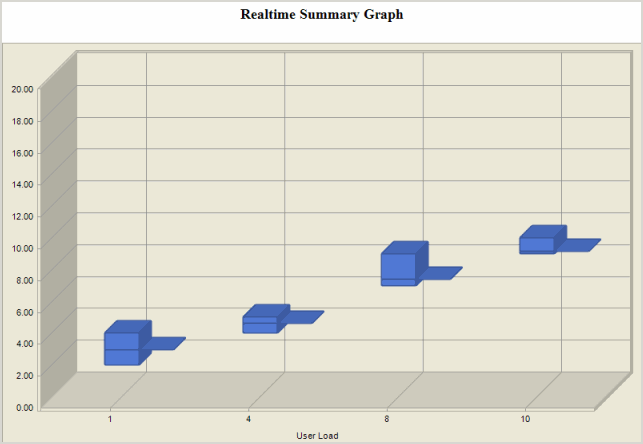
Realtime Summary

The Realtime Statistic graph allow you to view what "actually" happened during a load test. You can plot userload against:
  • Transaction/Second
  • Total Rows
  • Errors
  • Total Bytes
  • Rows/Second
  • Minimum Time
  • Maximum Response Time
  • Deadlocks
  • Bytes/Second
  • Average Time
  • Bytes/Second

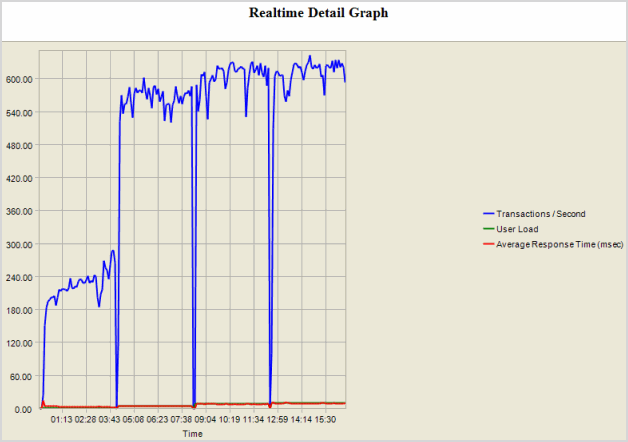
Realtime Detail

The Realtime Detail graph allows you to view what actually happened during the running of a load test. This allows you to view the actual timing events. From the Realtime Detail graph you can view:
  • Average Response Time
  • Average Time
  • Bytes/ Second
  • Deadlocks
  • Maximum Response Time
  • Maximum Time
  • Minimum Response Time
  • Minimum Time
  • Rows/Second
  • Total Bytes
  • Errors
  • Total Rows
  • Transactions/Second
  • User Load

Userload Statistics Table

This table is a snapshot of the workload test. You to quickly review a complete overview of database that includes, userload, transactions per second (TPS), average response time (sec).        

From this table you can drill down to view userload stastics.

To drill down from the Userload Statistics table
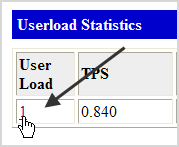
  1. Click on the required Userload.

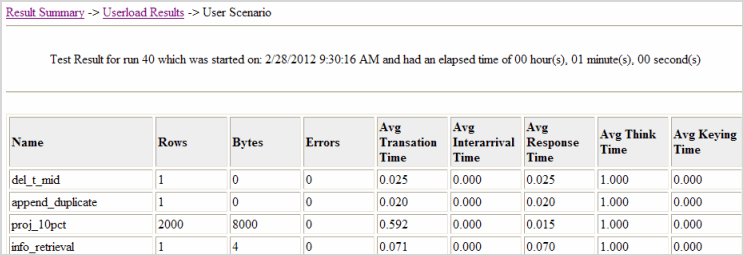
The Userload Results view displays.

  1. From this view, you drill down further by clicking on required User Scenario name.

This displays detailed test results broken down by row name.
Workload

The Workload view provides testing details.
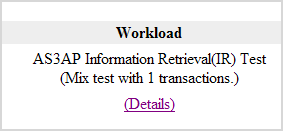
Clicking Details displays the transactions mix, timing, userload, and testing options used for the test.

Testbed

The Testbed view shows data on agent configuration and processes during the running of a job.
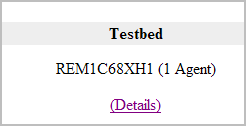
Clicking Details displays a table with machine and operating system details.

Database Under Test

This view displays connection and database information.
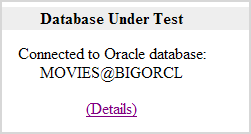
Click Details to display connection and database information details.


Viewing Multiple Run Results

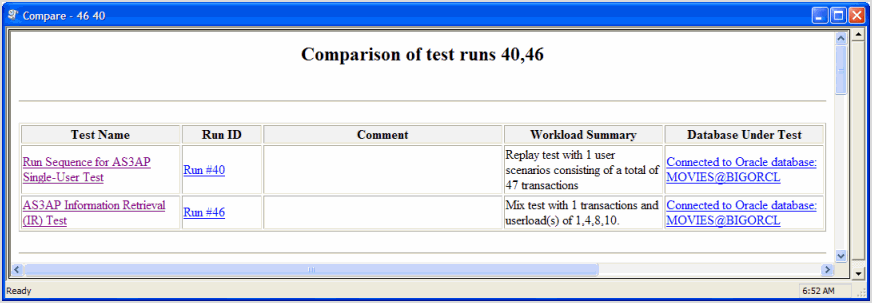
Benchmark Factory allows you to view and compare multiple results using Run Reports.

To view multiple Run Reports results
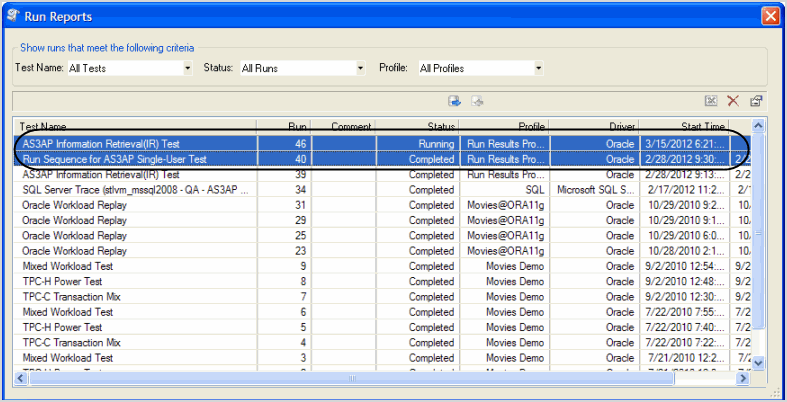
  1. Select the desired runs.

  1. Click the Show Test Results icon in the upper right corner of the dialog. Run Reports displays

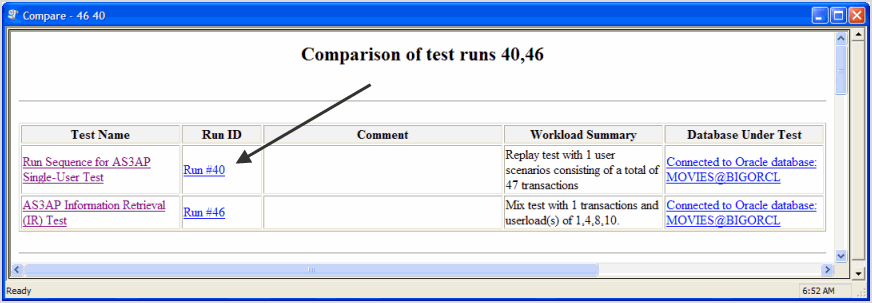
  1. Click on an individual test run to view those results.

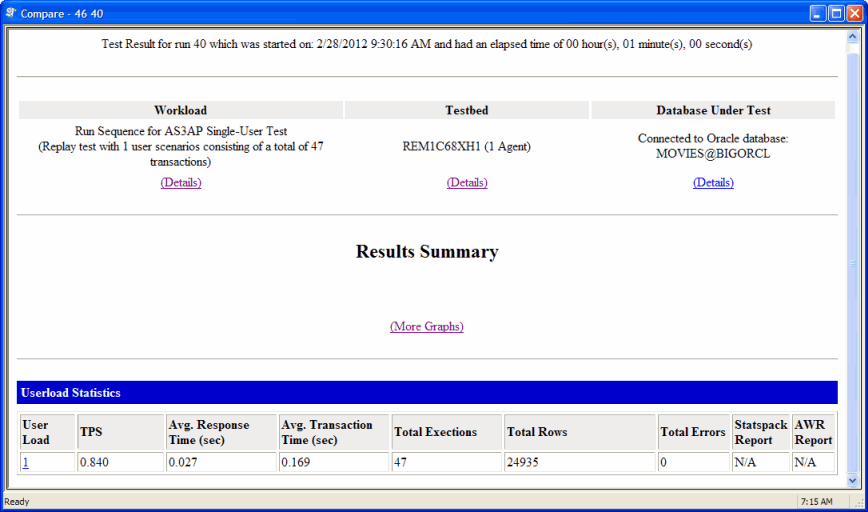
The results for that test display.

  1. Click on Details for Workload, Testbed, or Database Under Test to drill down on testing results.


The following graphic shows Testbed drill down results.

  1. Click More Graphs in Results Summary.

The Results Summary graphs display.

Note: To change Run Reports graph views, refer to Changing Graph Views.

View other graphs as required.

  1. Close Run Reports when finished viewing run results.


Exporting Test Results to Excel

You can export test results to Microsoft Excel from the Compare Results page and from the Run Reports component.

Note: Microsoft Excel must be installed to perform the following procedure.

To export load test results from Run Reports

  1. In Run Reports, click the Excel icon .
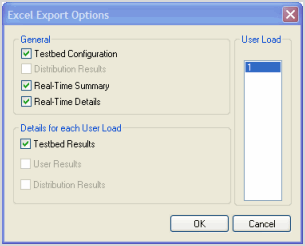
  2. Modify export options or accept the default settings.
  3. Click OK. The test results open in Excel.
  4. The test results open in Excel.
  5. You can then save the report as an Excel file.

To export test results to Excel from the Compare Results page

  1. Select a test run and click the Excel icon .
  2. Modify export options or accept the default settings.
  3. Click OK. The test results open in Excel.
  4. The test results open in Excel.
  5. You can then save the report as an Excel file.


Documentos relacionados

The document was helpful.

Selecione a classificação

I easily found the information I needed.

Selecione a classificação