Creating an AWS Agent
|
3 |
|
4 |
|
5 |
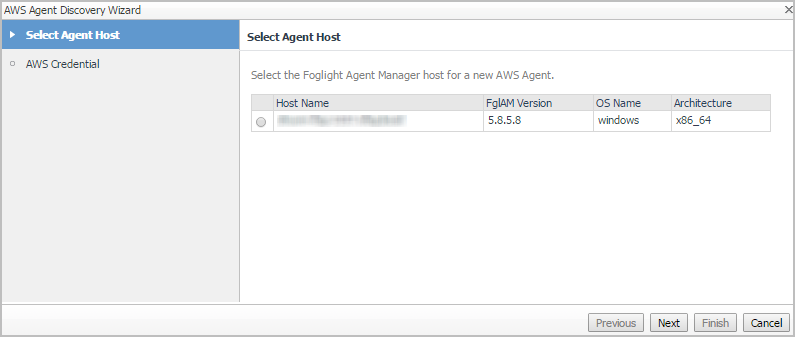
In the Select Agent Host view, select the agent manager on which the new agent is to be deployed, and then click Next. |
|
6 |
|
• |
Account Alias: The display name of this account. |
|
• |
|
• |
Secret Access Key: The secret access key retrieved in Getting authentication information through console. |
|
• |
Collect Memory Metric: Select this option to enable the collection of instance memory metrics. The default value is disabled. Foglight supports to collect memory metrics for both Windows and Linux OS. To enable Linux OS Memory Metrics collection, upload the private key and assign the credential to the required instance. For how to upload private key and assign the credential to required instance, refer to To create user name and password for an instance: on page 46. No additional tasks are required when enabling Windows OS memory metrics collection. |
|
• |
Collect Linux Volume Utilization: Select this option to enable the collection of Linux volume utilization. The default value is disabled. Foglight only supports to collect volume utilization for Linux OS. To enable Linux OS Memory Metrics collection, upload the private key and assign the credential to the required instance. For how to upload private key and assign the credential to required instance, refer to To assign credentials for AWS instances: on page 47. |
|
• |
Specify an agent name (Optional): Specify the name of agent. |
|
• |
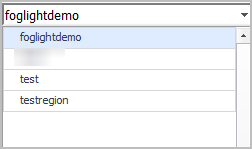
Configure regions to be monitored (Optional): Select AWS regions for monitoring. All regions will be monitored if this field is not configured. |
|
• |
Configure Account Cost to Monitor: Configure the Cost Metrics collection. Collections will start only after the AWS Cost and Usage Report are created on the AWS Console. See To create an AWS Cost and Usage Report. For more details, see Configure Account Cost to Monitor: on page 50. |
|
• |
Configure Proxy (Optional): Configure the proxy setting when the Agent Host requires a proxy connection to the Internet. For more details, see Configure Proxy (Optional): on page 51. |
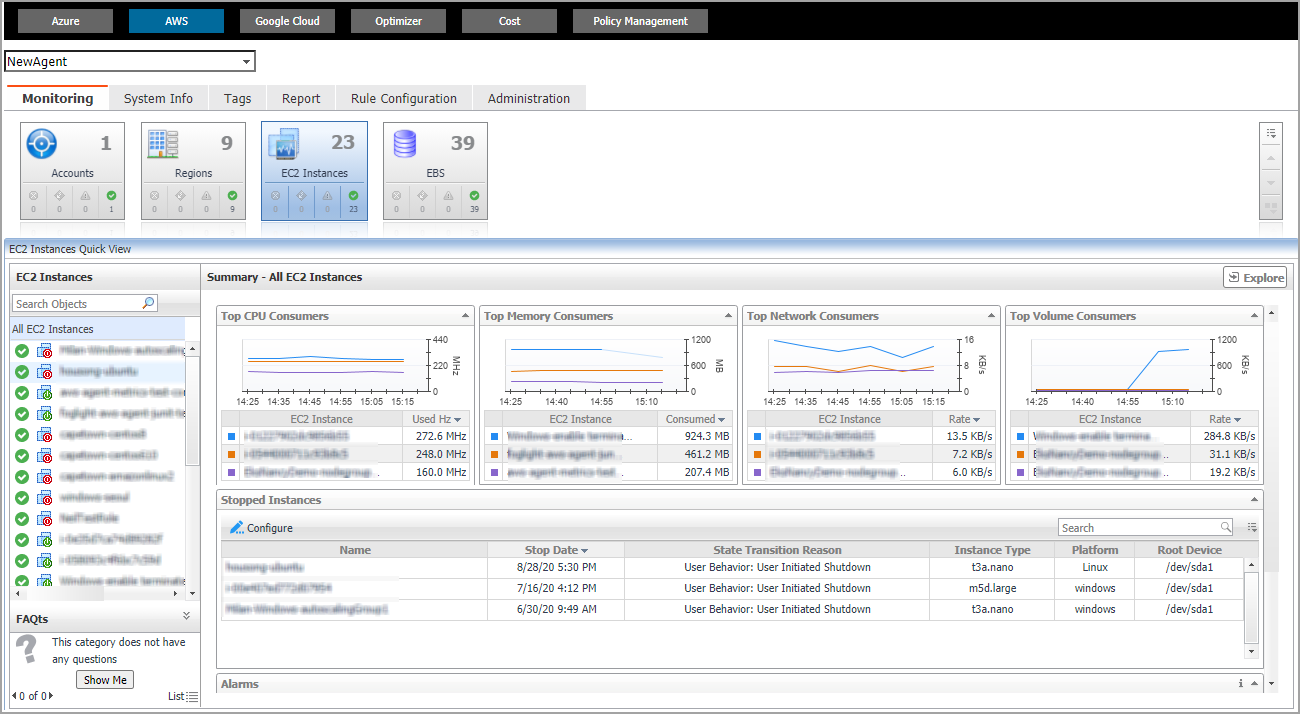
The new AWS Agent is created, and its data is to be displayed on the Monitoring tab after a few minutes.
Configuring data collection interval
Foglight Hybrid Cloud Manager enables you to configure the interval for data collection using the Agent Status dashboard.
|
1 |
|
2 |
On the Agent Status dashboard, select the AWS agent that you want to monitor, and then click Edit Properties. |
|
3 |
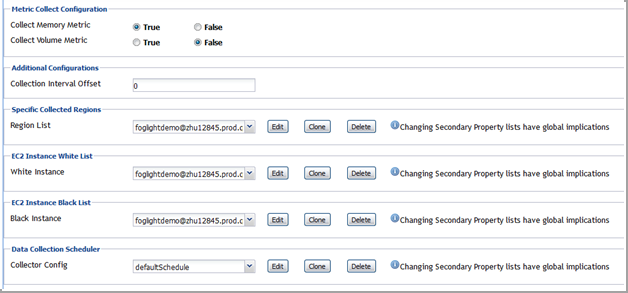
Select True for Collect Memory Metric and Collect Volume Metric, and then specify a value for Collection Interval Offset. |
|
• |
Collection Interval Offset must be set to a non-negative integer. |
|
• |
n represents the value of Collection Interval Offset. |
|
• |
I represents the value of Collector Config (in minutes). |
Dashboard location and UI elements
After installing Foglight Hybrid Cloud Manager for AWS, the Cloud Manager entry appears under Homes.
|
3 |
The Cloud Manager dashboard consists of the following UI elements:
|
• |


