
|
|
||
|
|
VMware® Datastore |
|
|
|
|
• |
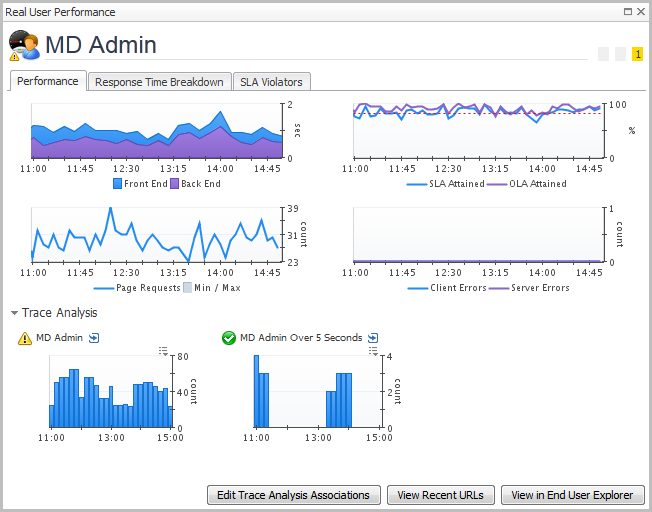
Click Edit Trace Analysis Associations to view and edit the state of the available counters that represent statistics for the monitored application. Select one or more of the available counters in the Edit Trace Analysis Associations dialog box to display their statistics in the Real User Performance detail view, under Trace Analysis. |

|
• |
Click View Recent URLs to drill down to the Foglight Experience Monitor (FxM) views and data. |
|
• |
Click View in End User Explorer to see the application statistics in the End User Explorer dashboard. For more information about this dashboard, see the Managing the Cartridge for FxM User and Reference Guide. |
|
• |
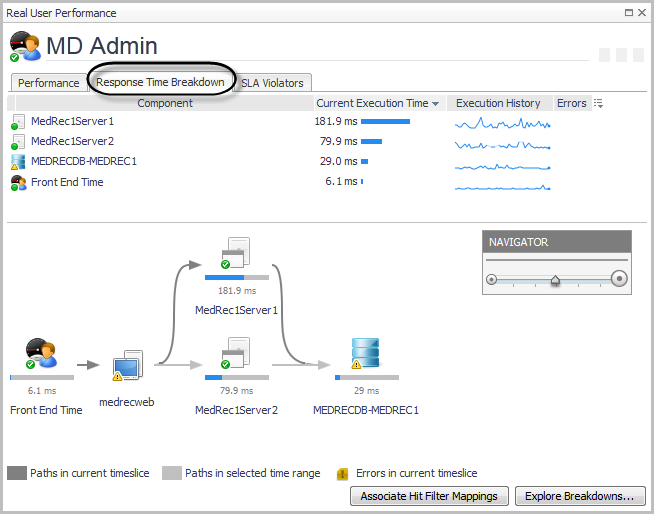
Click Associate Hit Filter Mappings. |
|
• |
Click Explore Breakdowns. |
|
TIP: If you click a datasource component icon, the details view also includes a Map to Application Component button. |
|
• |
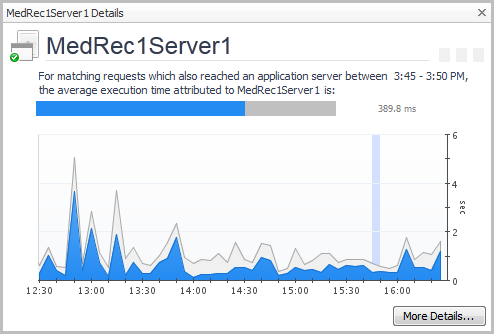
Click More Details to drill down to a detailed view of the selected application component. For example, from an application server component, you can access the Java™ application server details view. |
